. 2007 Nov 8;56(3):541-51.
doi: 10.1016/j.neuron.2007.09.029.

Attention governs action in the primate frontal eye field

Affiliations

Attention governs action in the primate frontal eye field

Robert J Schafer et al. Neuron. .

Abstract

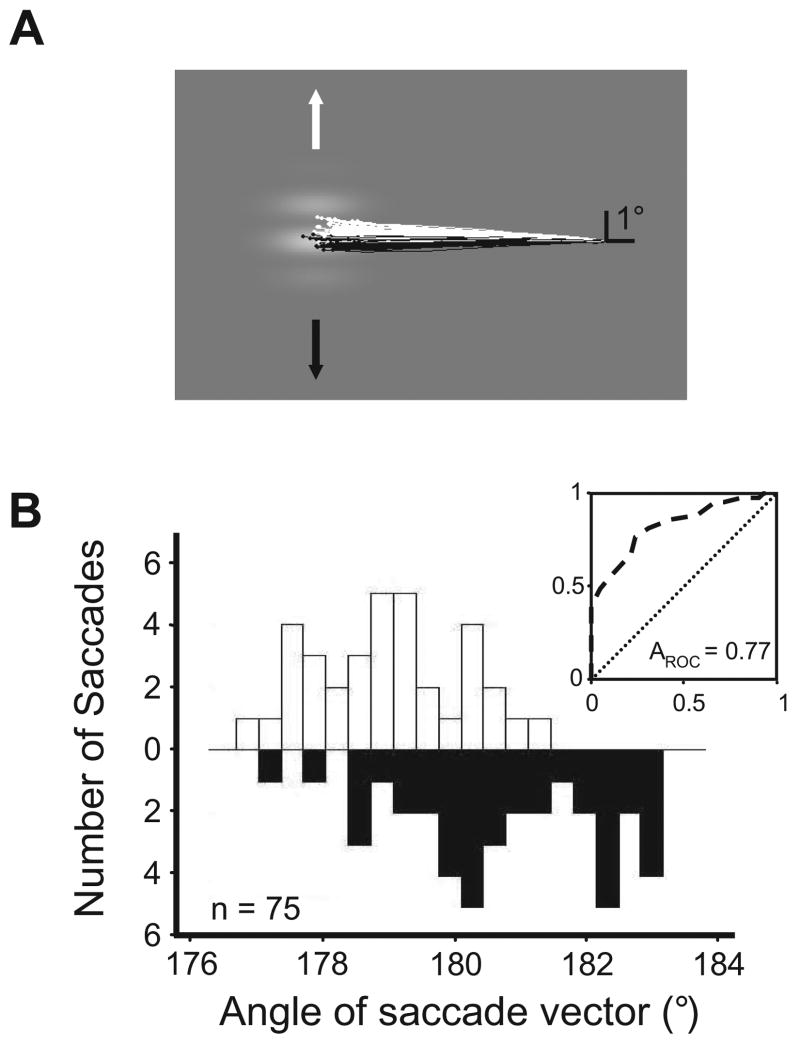
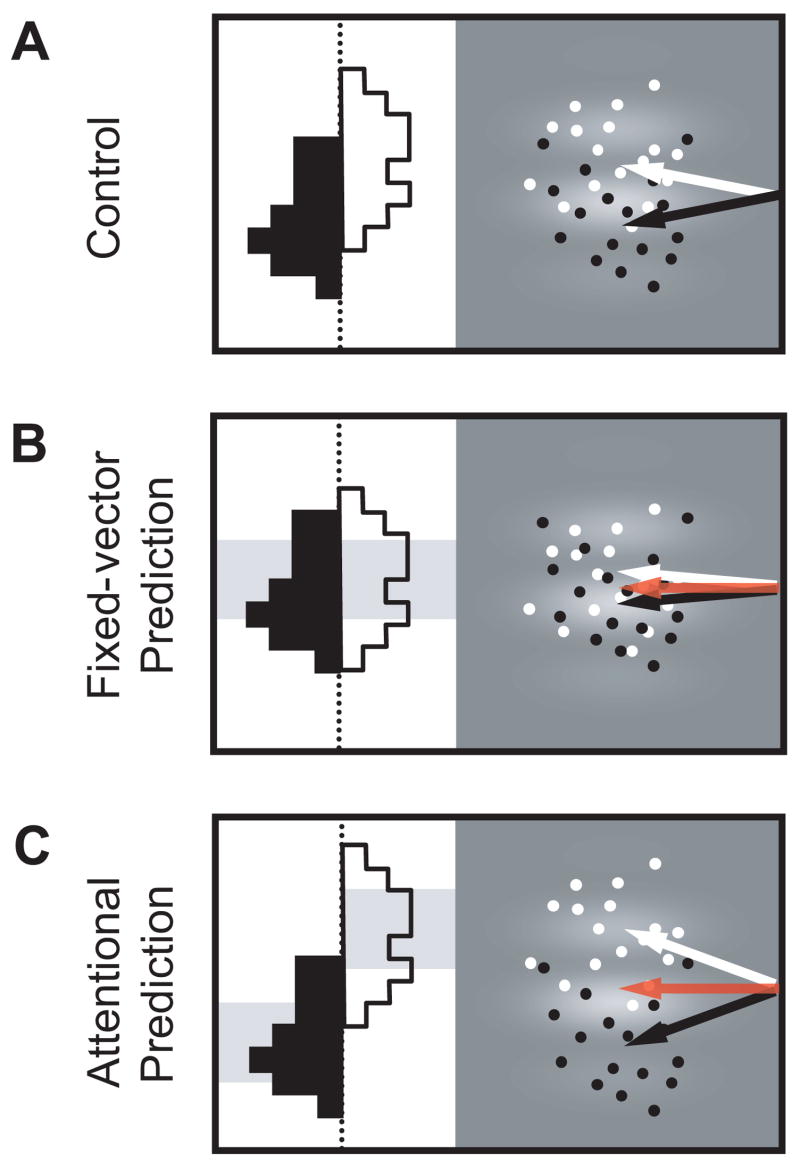
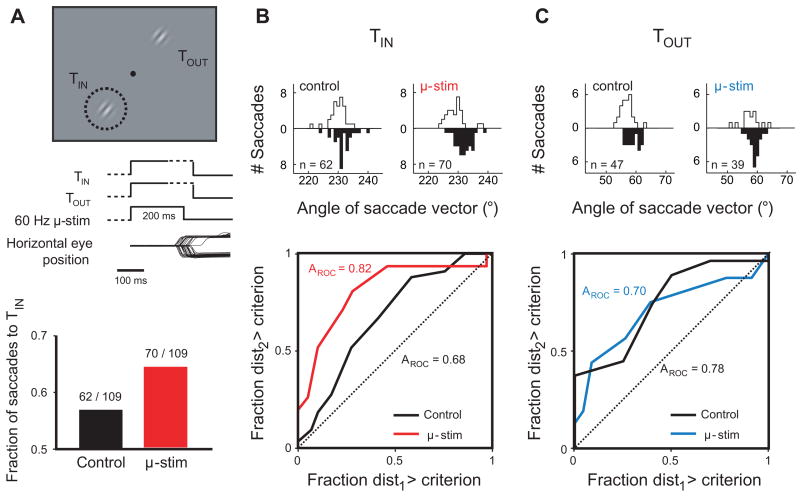
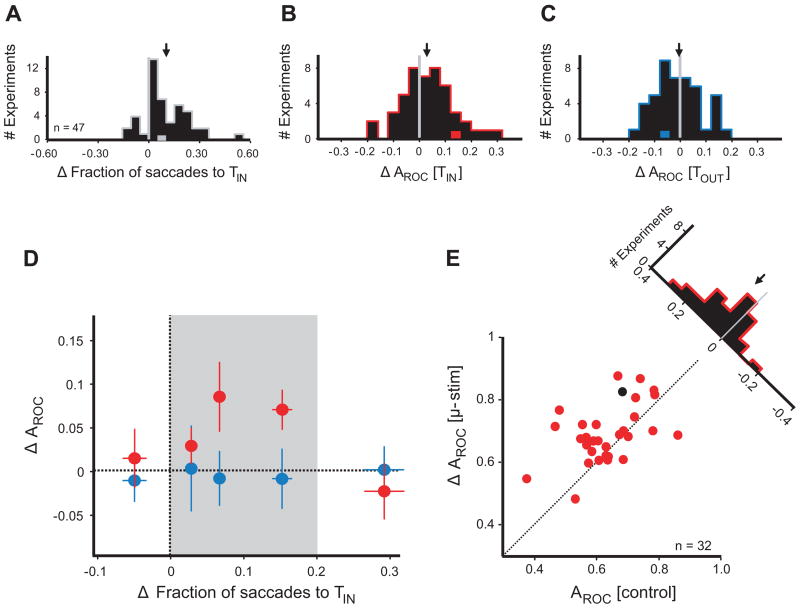
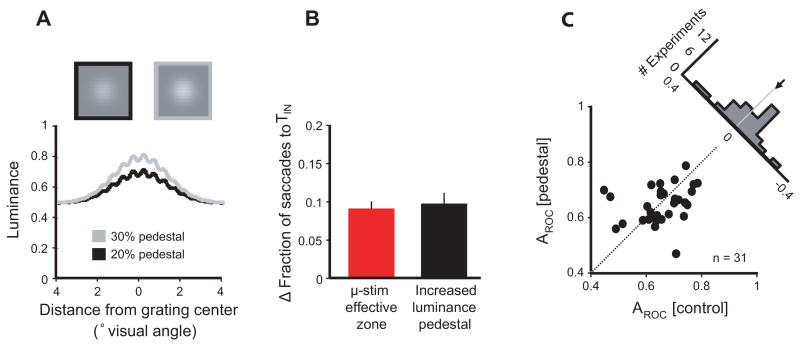
While the motor and attentional roles of the frontal eye field (FEF) are well documented, the relationship between them is unknown. We exploited the known influence of visual motion on the apparent positions of targets, and measured how this illusion affects saccadic eye movements during FEF microstimulation. Without microstimulation, saccades to a moving grating are biased in the direction of motion, consistent with the apparent position illusion. Here we show that microstimulation of spatially aligned FEF representations increases the influence of this illusion on saccades. Rather than simply impose a fixed-vector signal, subthreshold stimulation directed saccades away from the FEF movement field, and instead more strongly in the direction of visual motion. These results demonstrate that the attentional effects of FEF stimulation govern visually guided saccades, and suggest that the two roles of the FEF work together to select both the features of a target and the appropriate movement to foveate it.


Figures

Figure 1
Figure 1. Measuring the motion-induced bias (MIB) of saccadic eye movements
(A) Directional bias of saccades to a drifting grating. Eye position traces show voluntary saccades to a sinusoidal grating that drifted either upward (white traces and arrows) or downward (black traces and arrows). Monkeys were rewarded for saccades landing anywhere within the target grating. (B) Distributions of saccade vector angles and ROC analysis. Data are from a different experiment than that shown in (A). Distributions of saccade angles to gratings drifting in opposite directions (white and black) were used to generate an ROC curve (inset), the area under which (AROC) determines the amount of MIB.
Figure 2
Figure 2. Possible effects of FEF stimulation on the MIB
(A) MIB on control trials. Without microstimulation, saccade vectors are moderately influenced by grating motion. Points indicate hypothetical endpoints of saccades on trials with upward (white) and downward (black) grating motion; arrows indicate the mean saccade vectors. Histograms depict the distributions of saccade angles. (B) Fixed-vector prediction. Red arrow indicates the representative evoked saccade vector at the FEF site using suprathreshold (high-frequency) stimulation. Gray shaded region behind the histograms illustrates the fixed-vector bias of subthreshold (low-frequency) microstimulation, which is constant regardless of the direction of grating motion. If the motor effects of stimulation dominate, then the mean saccade vectors on trials with upward (white arrows) and downward (black arrows) grating motion are driven toward the electrically-evoked vector, and are thus more similar than in (A), leading to a decrease in the MIB. (C) Attentional prediction. Shaded regions again show the bias of microstimulation on saccade endpoints, this time away from the location of the evoked vector (red arrow) and dependent on the direction of grating motion. Mean saccade vectors (white and black arrows) deviate away from the electrically-evoked vector, leading to an increase in the MIB compared to (A).
Figure 3
Figure 3. Example experiment
(A) Task design and effect of subthreshold (low-frequency) FEF stimulation on the choice of saccade target. The dashed circle circumscribes the MF of the stimulation site, mapped prior to the experiment using suprathreshold (high-frequency) stimulation. TIN and TOUT refer to the visual targets placed at the center of, and directly opposite, the MF, respectively. Event plots indicate the sequence of appearance and disappearance of the visual targets and the duration of microstimulation; dashed lines denote variable time intervals. Horizontal eye position traces are from a subset of trials from this experiment, and show choice saccades to both TIN (downward deflecting traces) and TOUT (upward deflecting traces). Bar graph at bottom shows the effect of microstimulation on the fraction of saccades to TIN. Numbers above each bar are the number of TIN choices over the number of trials during each condition. (B) Effect of subthreshold microstimulation on the MIB of TIN saccades. At top, distributions of angles of saccade vectors (as in Figure 1B) to TIN during control (left) and microstimulation (right) trials. At bottom, ROC curves and areas (AROC) resulting from these distributions. (C) Effect of subthreshold microstimulation on the MIB of TOUT saccades.
Figure 4
Figure 4. Population analysis
(A) Effect of microstimulation on target choice. Histogram shows the change in the fraction of saccades to TIN with microstimulation. Arrow indicates the mean change. Gray data point represents the example experiment from Figure 3. (B) Effect of microstimulation on the MIB of TIN saccades. Histogram shows the difference in AROC of TIN saccade angle distributions between microstimulation and control trials. Arrow indicates the mean change. Red data point represents the experiment from Figure 3. (C) Effect of microstimulation on the MIB of TOUT saccades. As in b. Blue data point represents experiment from Figure 3. (D) Relationship between the MIB and target choice effects. The stimulation effect on the MIB is plotted against its effect on the fraction of saccades to TIN. Red circles indicate TIN MIB effects, blue circles indicate TOUT effects. Each circle is the mean of 9 or 10 experiments: the leftmost and rightmost circles of each color comprise 10. Error bars indicate standard error of the mean for both axes. Mean absolute current amplitudes used in the experiments represented by each of the five data points, from left to right, were 24.9 μA, 28.1 μA, 24.5 μA, 23.5 μA, and 23.7 μA. The shaded area (“effective zone”) highlights the range of target choice effects in which FEF stimulation increases the MIB. (E) MIB within the effective zone. For experiments falling within the microstimulation effective zone, AROC of TIN saccades with microstimulation is plotted against AROC of TIN control saccades. Each circle represents one experimental block. Black circle indicates the experiment from Figure 3. The histogram shows the difference in AROC due to microstimulation.
Figure 5
Figure 5. Increased target salience effects on choice and the MIB
(A) Normal grating and increased luminance pedestal grating. At top, a grating combined with a normal (20%) luminance pedestal (black border) is shown alongside a grating combined with a brighter (30%) luminance pedestal (gray border). For detail, both targets are shown at a higher spatial frequency than those used in the experiments. Below, a cross section through the center of each target is plotted in luminance space. (B) Comparison of the increases in saccades to TIN caused by microstimulation and the increased luminance pedestal. Only microstimulation experiments falling within the effective zone are included. Error bars indicate standard error of the mean. (C) Effect of target salience on the MIB. AROC of saccades to the high luminance pedestal target is plotted against AROC of saccades to the same target without the increased pedestal. Each circle represents one experimental block. The histogram shows the difference in AROC attributed to the increased luminance pedestal.

Comment in

Similar articles

Cited by

References

    1. Abe N, Takeuchi J. The “lob-pass” problem and an on-line learning model of rational choice. Proc 6th annual conference on computational learning theory; 1993. pp. 422–428.
    1. Armstrong KM, Fitzgerald JK, Moore T. Changes in visual receptive fields with microstimulation of frontal cortex. Neuron. 2006;50:791–798. - PubMed
    1. Armstrong KM, Moore T. Rapid enhancement of visual cortical response discriminability by microstimulation of the frontal eye field. Proc Natl Acad Sci USA. 2007;104:9499–9504. - PMC - PubMed
    1. Awh E, Armstrong KM, Moore T. Visual and oculomotor selection: links, causes and implications for spatial attention. Trends Cogn Sci. 2006;10:124–130. - PubMed
    1. Barborica A, Ferrera VP. Modification of saccades evoked by stimulation of frontal eye field during invisible target tracking. J Neurosci. 2004;24:3260–3267. - PMC - PubMed

Publication types

MeSH terms

LinkOut - more resources