. 2007 Dec 15;312(2):523-32.
doi: 10.1016/j.ydbio.2007.09.057. Epub 2007 Oct 5.

Genetic identification of a novel NeuroD1 function in the early differentiation of islet alpha, PP and epsilon cells

Affiliations

Genetic identification of a novel NeuroD1 function in the early differentiation of islet alpha, PP and epsilon cells

Christina S Chao et al. Dev Biol. .

Abstract

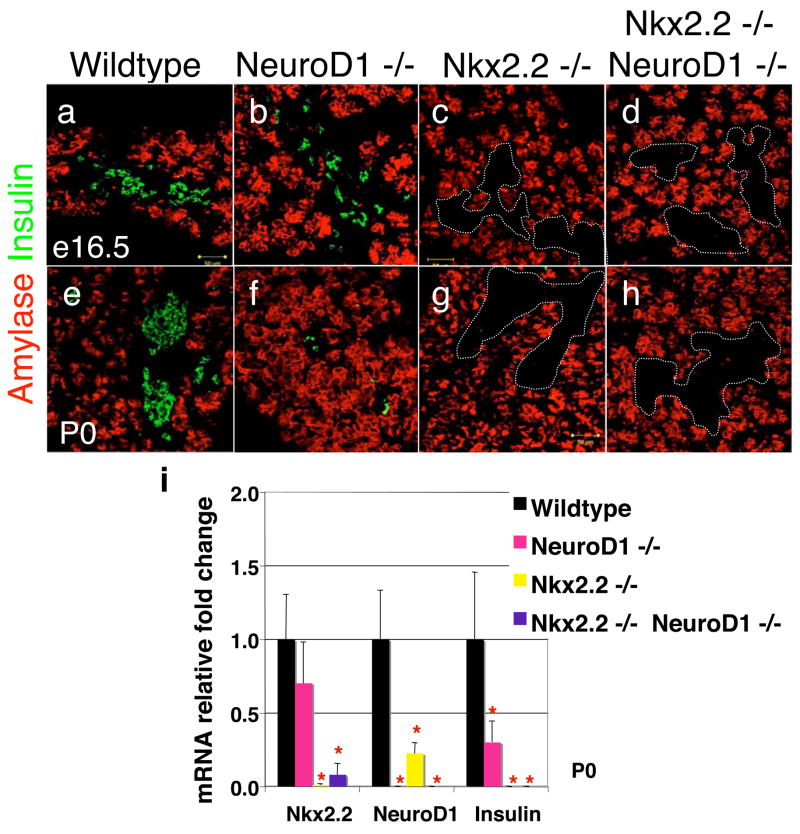
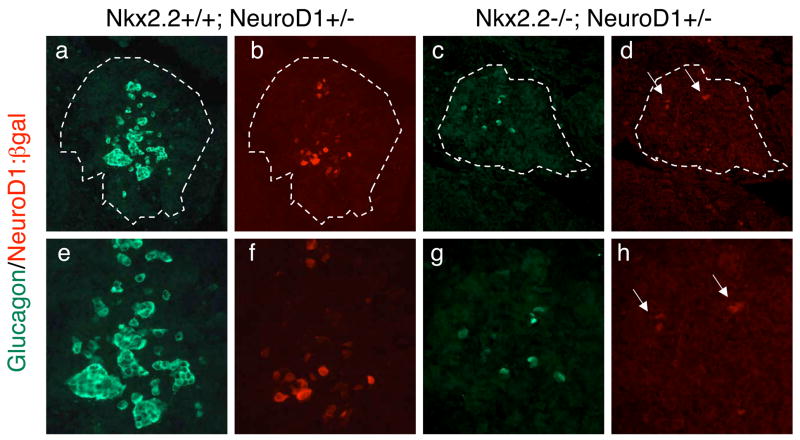
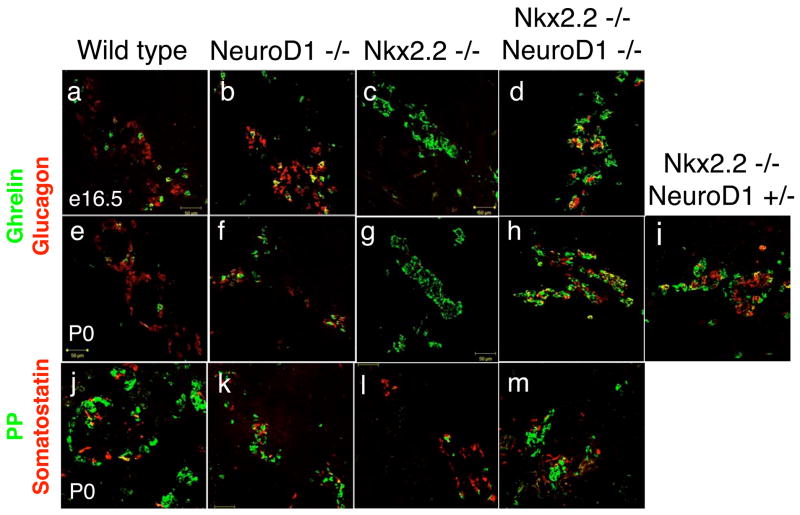
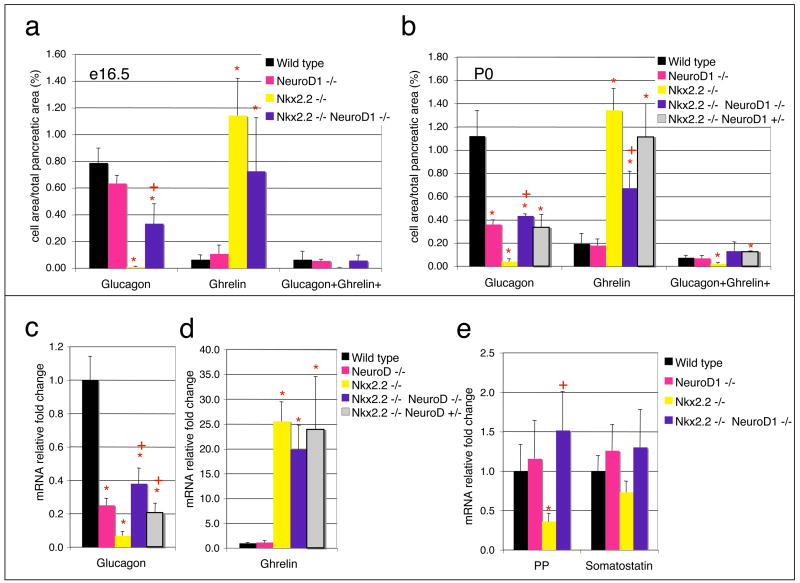
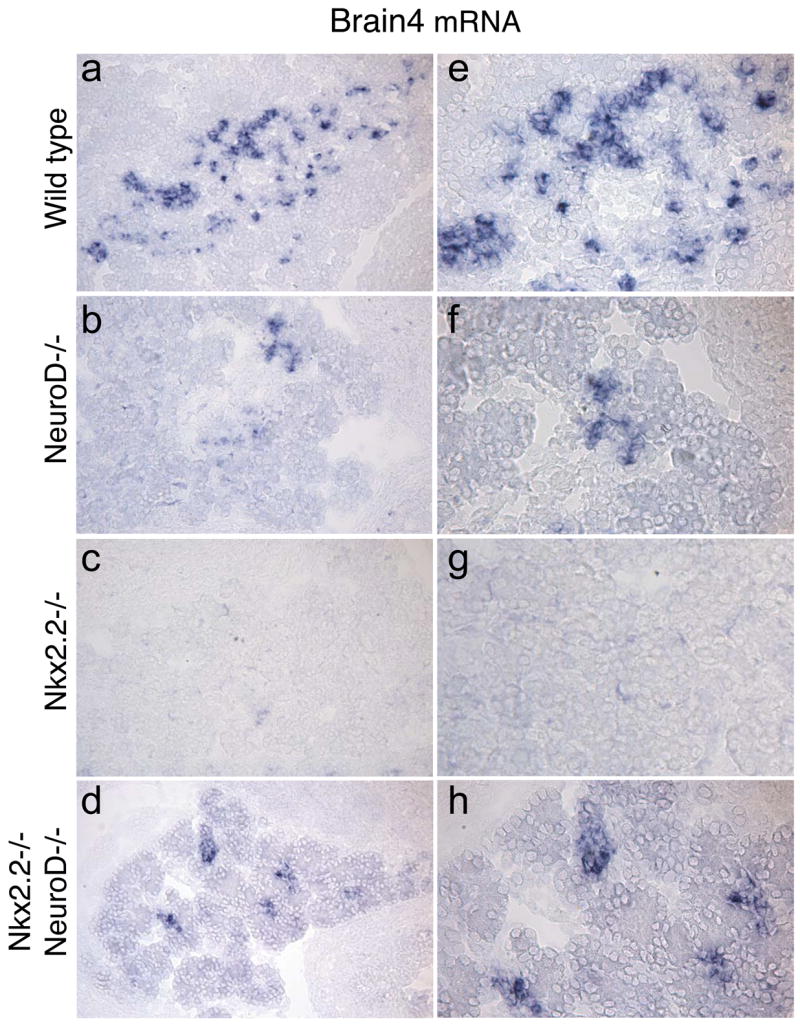
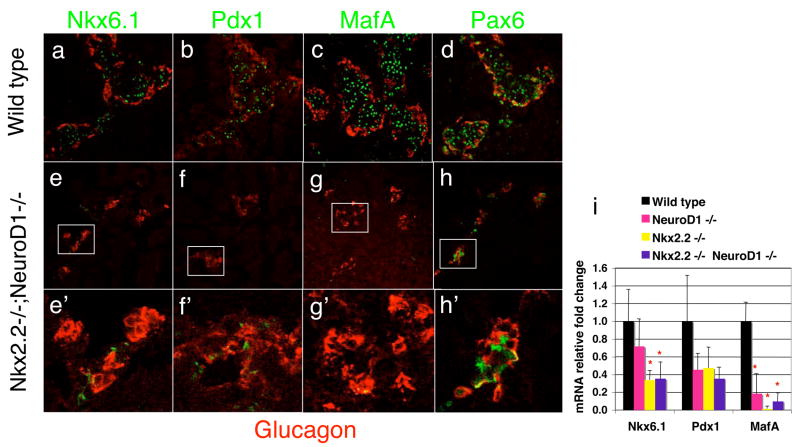
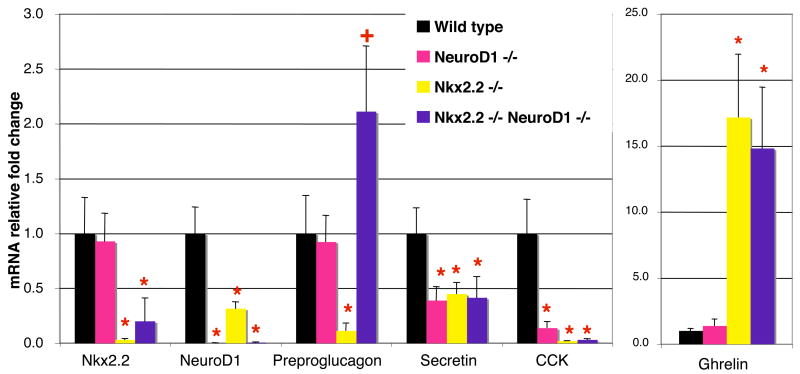
Nkx2.2 and NeuroD1 are vital for proper differentiation of pancreatic islet cell types. Nkx2.2-null mice fail to form beta cells, have reduced numbers of alpha and PP cells and display an increase in ghrelin-producing epsilon cells. NeuroD1-null mice display a reduction of alpha and beta cells after embryonic day (e) 17.5. To begin to determine the relative contributions of Nkx2.2 and NeuroD1 in islet development, we generated Nkx2.2-/-;NeuroD1-/- double knockout (DKO) mice. As expected, the DKO mice fail to form beta cells, similar to the Nkx2.2-null mice, suggesting that the Nkx2.2 phenotype may be dominant over the NeuroD1 phenotype in the beta cells. Surprisingly, however, the alpha, PP and epsilon phenotypes of the Nkx2.2-null mice are partially rescued by the simultaneous elimination of NeuroD1, even at early developmental time points when NeuroD1 null mice alone do not display a phenotype. Our results indicate that Nkx2.2 and NeuroD1 interact to regulate pancreatic islet cell fates, and this epistatic relationship is cell-type dependent. Furthermore, this study reveals a previously unappreciated early function of NeuroD1 in regulating the specification of alpha, PP and epsilon cells.


Figures

Figure 1
Figure 1. Insulin-producing β cells are absent in Nkx2.2−/−;NeuroD1−/− DKO mice
Immunofluorescence of insulin (green) and amylase (red) in e16.5 (A–D) and P0 (E–H) pancreas of wild type, NeuroD1−/−, Nkx2.2−/−, and Nkx2.2−/−;NeuroD1−/− DKO mice. Islet clusters are outlined by the dotted lines with no insulin staining. Quantitative PCR results for mRNA of Nkx2.2, NeuroD1 and insulin in P0 pancreas of wild type, NeuroD1−/−, Nkx2.2−/−, and Nkx2.2−/−;NeuroD1−/− DKO mice (I). N = 3–6 pancreas per genotype. Significance was calculated using the two-tailed student t-test with unequal variance. P value of <0.05 is indicated by an * compared to wild type phenotype.
Figure 2
Figure 2. NeuroD1 expression in Nkx2.2−/− islets
Immunofluorescence of glucagon (green) and β-galactosidase (red) in e12.5 tissue. The β-galactosidase signal reflects NeuroD1 expression since the cytoplasmic LacZ gene has been knocked into the NeuroD1 genomic locus. Nkx2.2+/+; NeuroD1+/− at 20x (a, b) and 40x (e, f) magnification. Nkx2.2−/−; NeuroD1+/− at 20x (c, d) and 40x (g, h) magnification.
Figure 3
Figure 3. Glucagon-producing α cells and Ghrelin-producing ε cells partially restored in Nkx2.2−/−;NeuroD1−/− DKO mice
Immunofluorescence of glucagon (red) and ghrelin (green) in e16.5 (A–D) and P0 (E–I) tissue of wild type, NeuroD1−/−, Nkx2.2−/−, Nkx2.2−/−;NeuroD1−/− DKO, and Nkx2.2−/−NeuroD1+/− mice. Immunofluorescence of PP (green) and somatostatin (red) in P0 (J–M) tissue of wild type, NeuroD1−/−, Nkx2.2−/−, and Nkx2.2−/−;NeuroD1−/− DKO mice.
Figure 4
Figure 4. Quantification of mRNA and islet hormone-positive area
Graphs of the percent immunofluorescent glucagon, ghrelin, and glucagon+ghrelin+ cell area per total pancreatic area from e16.5 (A) and P0 (B) tissues. Every ten sections from 100 sections for each genotype, wild type, NeuroD1−/−, Nkx2.2−/−, Nkx2.2−/−;NeuroD1−/−, and Nkx2.2−/−NeuroD1+/− mice were counted. N=3 for each genotype in cell area counts. Quantitative PCR results for fold change of glucagon (C) and ghrelin (D) mRNA in P0 pancreas of wild type, NeuroD1−/−, Nkx2.2−/−, Nkx2.2−/v;NeuroD1−/−, and Nkx2.2−/−NeuroD1+/− mice. Real time PCR results for fold change of PP and somatostatin mRNA in P0 pancreas of wild type, NeuroD1−/−, Nkx2.2−/−, and Nkx2.2−/−;NeuroD1−/− DKO mice (E). n = 3–6 pancreas per genotype in all qPCRs. Significance was calculated using the two-tailed student t-test with unequal variance. P value of <0.05 is indicated by an * compared to wild type and + compared to Nkx2.2 knockout phenotype.
Figure 5
Figure 5. Brn4 expression in recovered glucagon cells in Nkx2.2−/−;NeuroD1−/− DKO mice
RNA in situ analysis for Brn4 expression on wild type (A, E), NeuroD1−/− (B, F), Nkx2.2−/− (C, G) and Nkx2.2−/−;NeuroD1−/− DKO (D, H) tissue. E – H are higher magnification images of staining in A–D.
Figure 6
Figure 6. Transcription Factor Profile of Nkx2.2−/−;NeuroD1−/− DKO mice
Immunofluorescence images at P0 of wild type (A–D) and Nkx2.2−/−;NeuroD1−/− DKO (E–H) mice for glucagon (red: A–H), and Nkx6.1 (green: A, E), Pdx1 (green: B, F), MafA (green: C, G) and Pax6 (green: D, H). An enlarged image of panel D shows in wild type islets some alpha cells do not normally express Pax6 (arrow). Panels A–H are images taken on a Zeiss LSM 5 confocal microscope at 25x. E′–H′ are 40x images of the islets shown in E–H. Quantitative PCR results for fold change of Nkx6.1, Pdx1, and MafA in P0 pancreas of wild type, NeuroD1−/−, Nkx2.2−/−, and Nkx2.2−/−;NeuroD1−/− DKO mice (I). n = 3–6 pancreas per genotype in qPCR. Significance was calculated using the two-tailed student t-test with unequal variance. P value of <0.05 is indicated by an * compared to wild type and + compared to Nkx2.2 knockout phenotype.
Figure 7
Figure 7. Preproglucagon-producing cells in the intestine also recovered in Nkx2.2−/−;NeuroD1−/−DKO mice
Quantitative PCR of Nkx2.2, NeuroD1, preproglucagon, secretin, CCK and ghrelin mRNA in P0 intestine of wild type, NeuroD1−/−, Nkx2.2−/−, and Nkx2.2−/−;NeuroD1−/− DKO mice. N = 3–6 pancreas per genotype in qPCR. Significance was calculated using the two-tailed student t-test with unequal variance. P value of <0.05 is indicated by an * compared to wild type phenotype.

References

    1. Cerf ME, et al. Transcription factors, pancreatic development, and beta-cell maintenance. Biochem Biophys Res Commun. 2005;326:699–702. - PubMed
    1. Chu K, et al. BETA2 and pancreatic islet development. Recent Prog Horm Res. 2001;56:23–46. - PubMed
    1. Collombat P, et al. The simultaneous loss of Arx and Pax4 genes promotes a somatostatin-producing cell fate specification at the expense of the alpha- and beta-cell lineages in the mouse endocrine pancreas. Development. 2005;132:2969–80. - PubMed
    1. Collombat P, et al. Opposing actions of Arx and Pax4 in endocrine pancreas development. Genes Dev. 2003;17:2591–603. - PMC - PubMed
    1. Decker K, et al. Gata6 is an important regulator of mouse pancreas development. Dev Biol. 2006;298:415–29. - PMC - PubMed

Publication types

MeSH terms