. 2008 Jan;42(1):180-92.
doi: 10.1016/j.bone.2007.09.046. Epub 2007 Sep 26.

NHA-oc/NHA2: a mitochondrial cation-proton antiporter selectively expressed in osteoclasts

Affiliations

NHA-oc/NHA2: a mitochondrial cation-proton antiporter selectively expressed in osteoclasts

R A Battaglino et al. Bone. 2008 Jan.

Abstract

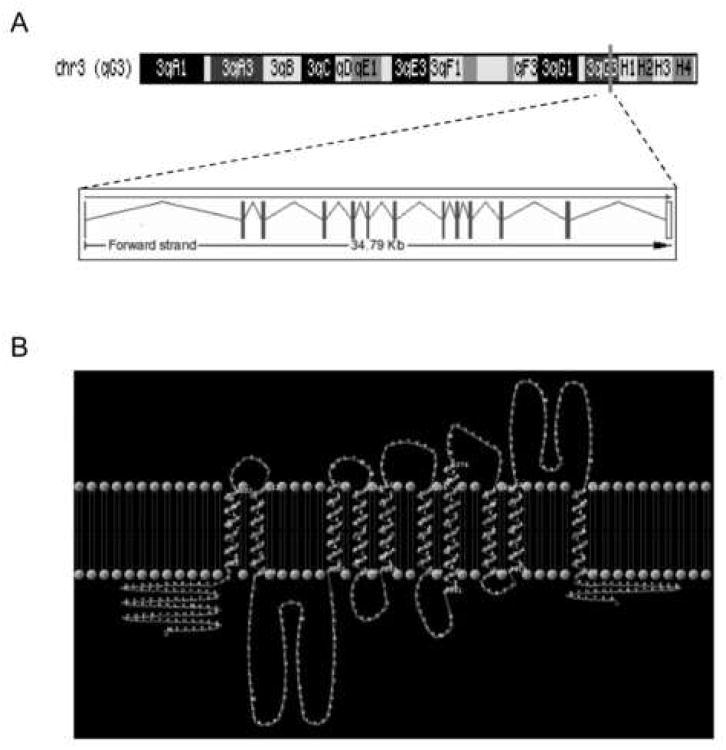
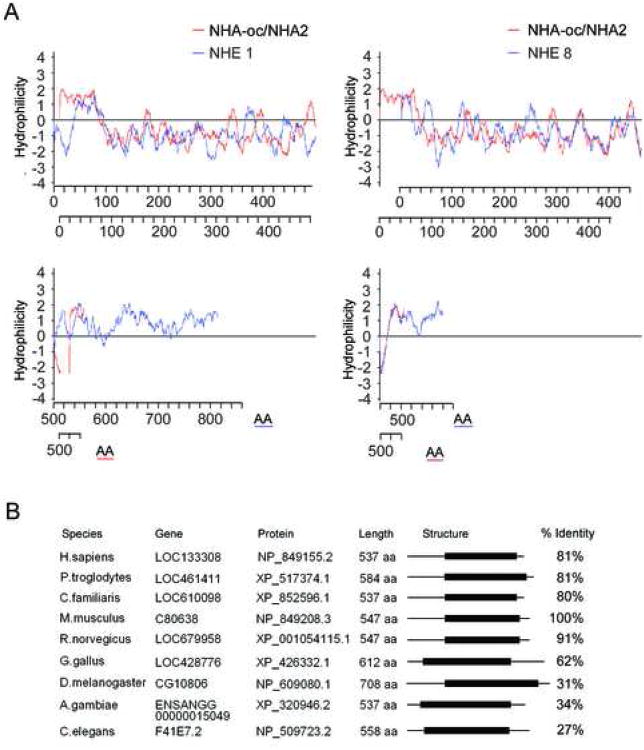
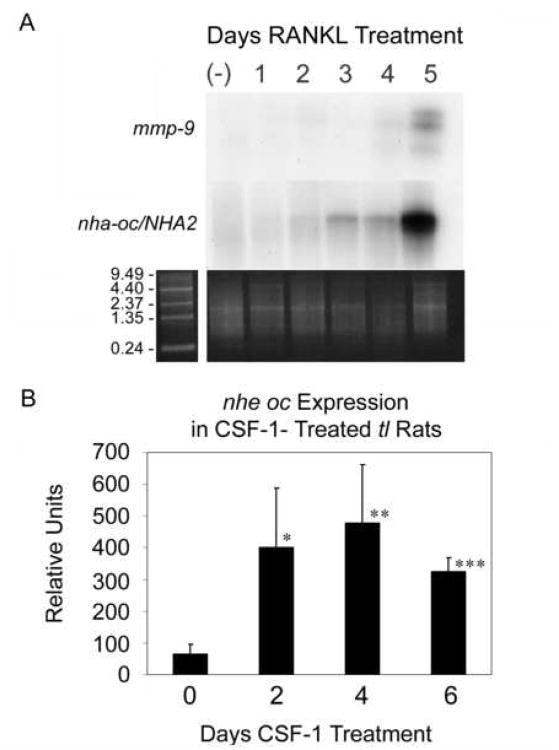
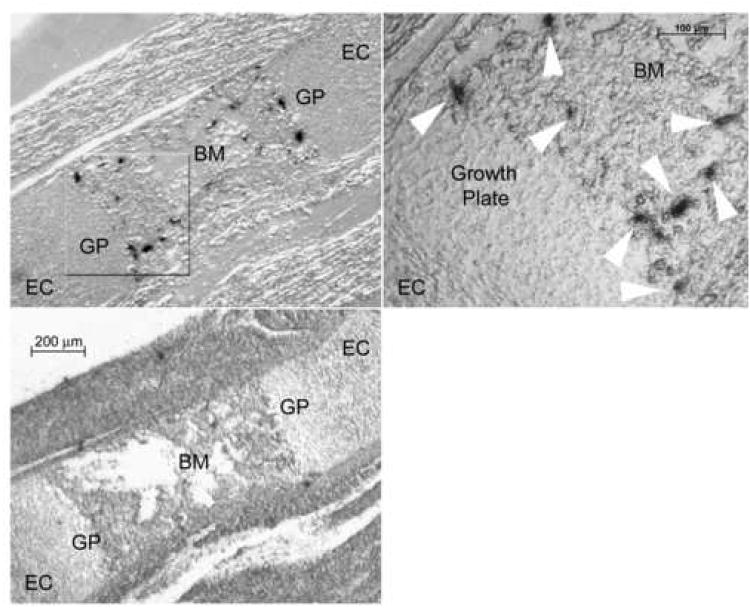
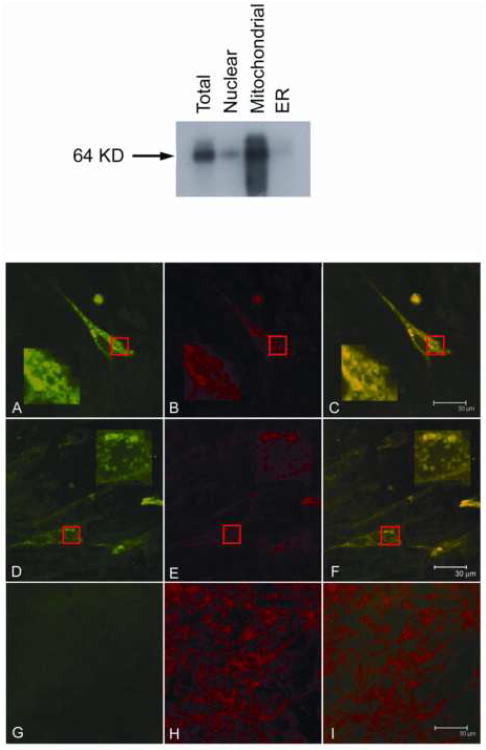
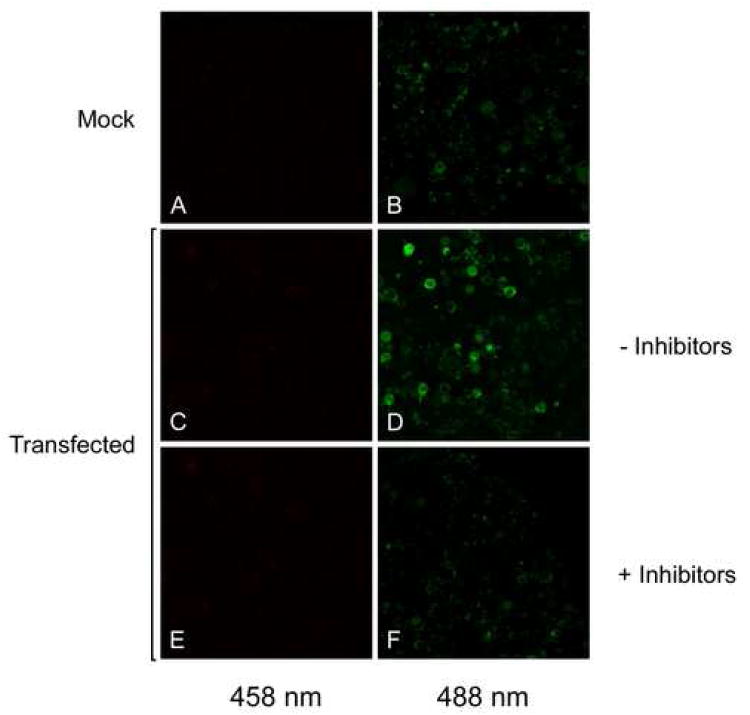
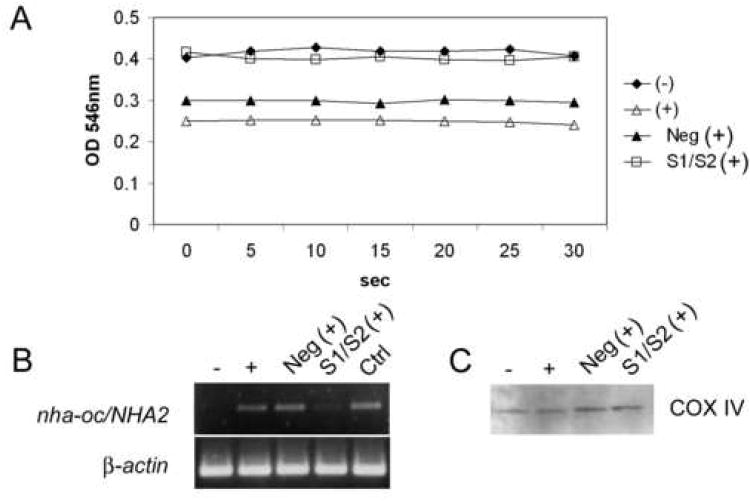
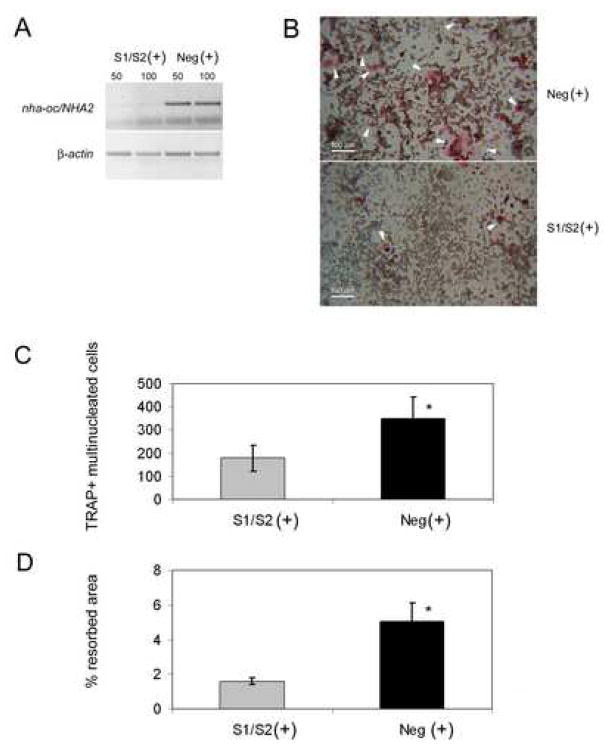
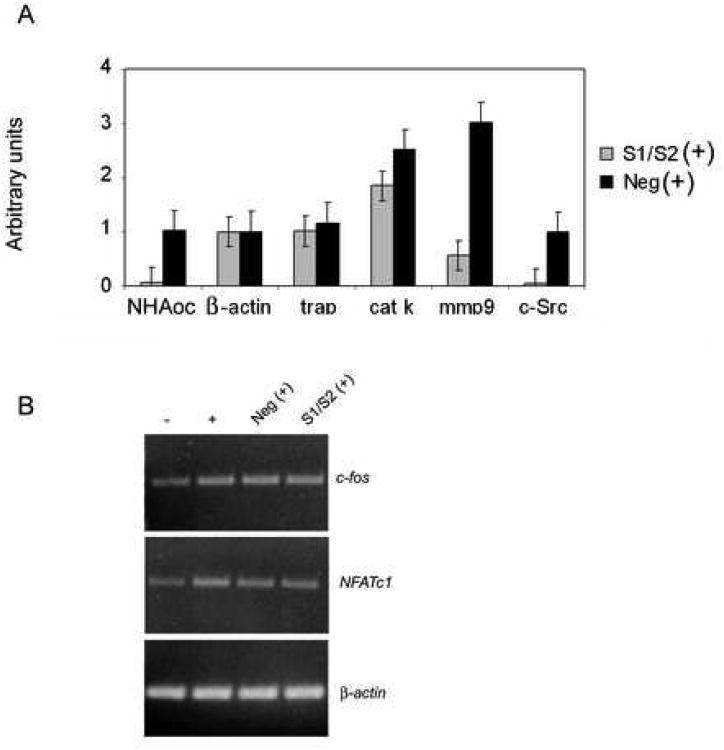
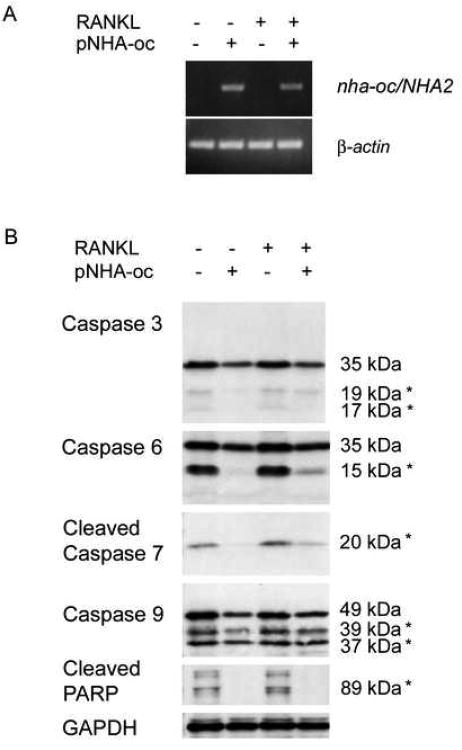
Bone resorption is regulated by a complex system of hormones and cytokines that cause osteoblasts/stromal cells and lymphocytes to produce factors including RANKL, that ultimately result in the differentiation and activation of osteoclasts, the bone resorbing cells. We used a microarray approach to identify genes upregulated in RANKL-stimulated osteoclast precursor cells. Osteoclast expression was confirmed by multiple tissue Northern and in situ hybridization analysis. Gene function studies were carried out by siRNA analysis. We identified a novel gene, which we termed nha-oc/NHA2, which is strongly upregulated during RANKL-induced osteoclast differentiation in vitro and in vivo. nha-oc/NHA2 encodes a novel cation-proton antiporter (CPA) and is the mouse orthologue of a human gene identified in a database search: HsNHA2. nha-oc/NHA2 is selectively expressed in osteoclasts. NHA-oc/NHA2 protein localizes to the mitochondria, where it mediates Na(+)-dependent changes in mitochondrial pH and Na(+) acetate induced mitochondrial passive swelling. RNA silencing of nha-oc/nha2 reduces osteoclast differentiation and resorption, suggesting a role for NHA-oc/NHA2 in these processes. nha-oc/NHA2 therefore is a novel member of the CPA family and is the first mitochondrial NHA characterized to date. nha-oc/NHA2 is also unique in that it is the first eukaryotic and tissue-specific CPA2 characterized to date. NHA-oc/NHA2 displays the expected activities of a bona fide CPA and plays a key role(s) in normal osteoclast differentiation and function.


Figures

Figure 1
Figure 1
(A) Genomic localization and gene structure of nha-oc/NHA2 (B) Analysis of NHA-oc/NHA2 using the TMHMM Server v. 2.0 predicts the existence of 10 trans-membrane segments (see also Table 1). Using that data the TMRPres2D tool generated 2 dimensional rendering of NHA-oc/NHA2. The TMHMM analysis predicts that both N- and C-terminus are located on the same side of the membrane
Figure 2
Figure 2
(A) A comparison between the hydropathic profiles of NHA-oc/NHA2 (red line) and NHE1 (blue line, left panel) or NHE8 (blue line, right panel) shows that NHA-oc/NHA2 has similar structural features, even though there is no significant sequence homology between NHA-oc/NHA2 and either NHE. (B) nha-oc/NHA2 metazoan orthologues. For all the genes the species, the gene, protein accession numbers, and the shared NHE domain, (shown as a black box) is indicated. The right column indicates the similarity between the mouse NHA-oc/NHA2 and the other orthologues (in percentage).
Figure 3
Figure 3. nha-oc/NHA2 mRNA expression
(A) Northern Blot analysis of differentiating RAW 264.7 cells (top panel) shows similar temporal expression of the nha-oc/NHA2 2 Kb message and mmp-9 in response to RANKL stimulation. The ethidium bromide stained poly A+ gel (bottom panel) is shown as a loading control. (B) RT-PCR analysis of nha-oc/NHA2 expression in tl rats. Each time was done in quadruplicate ie, tibia + femur from 4 different animals, 1 animal per chip. Statistical analyses were done as t-tests assuming equal variances, validated by first doing F-tests for variance using Excel * p < 0.01, ** p < 0.005, *** p < 0.00001.
Figure 4
Figure 4
nha-oc/NHA2 mRNA expression in situ. Adjacent 17.5 dpc femur sections were hybridized to a S-labeled nha-oc/NHA2-specific riboprobe (top, right panel). The highlighted area is shown in a magnified photograph (top, right panel). nha-oc/NHA2 expressing cells (white arrow heads) can be seen on the boundaries of the growth plate, consistent with osteoclast expression. A control (“sense”) S-labeled riboprobe was used as a control (bottom, left panel). EC: epiphyseal cartilage, GP: growth plate, BM: bone marrow.
Figure 5
Figure 5
(top) nha-oc/NHA2 subcellular localization. PS120 cells were transfected with pNHA-oc/NHAoc/V5-6× His. 48 hours later the nuclear, mitochondrial and ER subcellular fractions were separated. Protein extracts were prepared from each fraction and 10 μg each analyzed by western blotting using a α-V5 antibody and an HRP-linked anti mouse antibody. Control total cell extracts were included. A 64 KDa band (the predicted size of the NHA-oc/NHA2/V5-6× His fusion protein) appears predominantly in the mitochondrial fraction. (bottom) nha-oc/NHA2 subcellular localization. PS120 cells were transfected with pNHA-oc/NHAoc/V5-6× His and stained with α-V5 antibody/Alexafluor 488 Goat anti-mouse IgG2a (primary/secondary) and Mitofluor Red 589 and. Confocal images of representative cells show the antibody-specifc signal in green (panels A and D) and the Mitofluor signal in red (panels B and E) . The superimposed images (in yellow) show co localization (panels C and F). In each case, highlighted areas are magnified to better visualize the staining patterns. Mock-transfected cells were included as controls (panels G, H and I). Note that in mock-transfected cells there is Mitofluor signal but no α-V5 antibody/Alexafluor 488 Goat anti-mouse signal.
Figure 6
Figure 6
NHA-oc/NHA2 mediates Na+- induced mitochondrial pH change. PS120 cells were transfected with pNHA-oc/V5-6× His. 48 hours later cells were permeabilized and incubated for 10 min with BCECF in the presence of 50mM Na+ after which Na+ was abruptly removed. Cells were excited at 458 nm (A, C, E) and 488 nm (B, D, F) and confocal microscope images were recorded. Removing Na+ induces a pH change that can be observed as a brighter image at 488 nm (D). That change is greatly reduced in the presence of 20 μM EIPA and 20μM HMA (C). Mock-transfected cells show no change in mitochondrial pH after Na+ removal (A and B).
Figure 7
Figure 7
NHA-oc/NHA2 mediates Na+- induced mitochondrial swelling. (A) RAW 264.7 cells were transfected with a mix of nha-oc/NHA2-specific siRNA molecules and stimulated with RANKL. 4 days later mitochondria were isolated and resuspended in Na+-swelling buffer. For this experiments we used equivalent amounts of mitochondria (100μg protein). OD546 was recorded every 5 sec for 30 sec. A drop in OD546 indicates swelling of the mitochondrial matrix. (-) unstimulated cell; (+) RANKL stimulated; (Neg) RANKL stimulated, treated with a control siRNA; (S1/S2) RANKL stimulated, treated with a specific siRNA mix. (B) RNA from RAW264.7 cells, was analyzed by RT-PCR using nha-oc/NHA2-specific (top) or p-actin (bottom) primers. (-) un-stimulated cells; (+) RANKL stimulated; (Neg) RANKL stimulated, treated with a control siRNA; (S1/S2) RANKL stimulated, treated with a specific siRNA mix. Densitometric analysis of the gel shows that S1/S2 treatment results in a reduction of >90% in the nha-oc/NHA2 amplification product. (C) As a loading control, 10 μl of each mitochondrial fraction were analyzed by Western Blot analysis using a mitochondrial-specific COX IV antibody. A single 18KDa band of equal intensity can be seen in all lanes.
Figure 8
Figure 8
nha-oc/NHA2oc silencing inhibits osteoclast differentiation and activity. (A) RANKL-stimulated RAW 264.7 cells were transfected with nha-oc/NHA2-specific (S1/S2 (+)) or control (Neg (+)) siRNA. We first tested two siRNA concentrations: 50 nM (lanes 50) or 100 nM (lane 100) and chose the former for further experiments. Total RNA was isolated and subjected to RT-PCR analysis using nha-oc/NHA2- (top) or β-actin (bottom)- specific primers. Image analysis shows that the knock-down efficiency is over 90%. (B) (C) RANKL-stimulated RAW 264.7 cells were transfected with nha-oc/NHA2-specific (S1/S2 +) or control (Neg +) small inhibiting RNA (siRNA). After 4 days cells were fixed and stained for TRAP. The formation of multinucleated TRAP+ cells (white arrow-heads) is significantly reduced in nha-oc/NHA2-siRNA treated cultures (bottom panel) * p < 0.05 (D) nha-oc/NHA2-silencing inhibits the ability of differentiated RAW 264.7 cells to form resorption pits on a calcium phosphate matrix * p < 0.05.
Figure 9
Figure 9
nha-oc/NHA2 silencing blocks terminal osteoclast differentiation. (A) nha-oc/NHA2 silencing inhibits expression of the osteoclast-specific genes nha-oc/NHA2, trap, cathepsin K, mmp-9 and c-src. Expression of β-actin is not affected. nha-oc/NHA2silencing also inhibits osteoclast resorption (bottom panel). Experiments were done in triplicates. * p < 0.05. (C) Expression of c-Fos and NFATc1, like that of TRAP, is not affected by nha-oc/NHA2 silencing, which strengthen the notion that NHA-oc/NHA2 activity is required for terminal osteoclast differentiation.
Figure 10
Figure 10
nha-oc/NHA2 overexpression prevents caspase activation in RAW 264.7 cells. RAW 264.7 cells were transfected with pNHA-oc/V5-6X His. 48 hours later cells were stimulated with RANKL overnight (RANKL +, pNHA-oc +). Control cultures were unstimulated (RANKL -, pNHA-oc +). In parallel, cell were mock transfected and either RANKL-stimulated (RANKL +, pNHA-oc -) or not (RANKL -, pNHA-oc -). Three days after the transfection, protein and RNA was prepared and analyzed. (A) RT-PCR analysis of transfected and mock transfected cells show nha-oc/NHA2 expression only in transfected cells. (B) Protein extracts were subjected to Western Blot analysis using caspase-specific antibodies. Caspase activation is inhibited in cells expressing nha-oc/NHA2, regardless RANKL stimulation. An asterisk next to the molecular weight indicates that those bands represent the cleaved (not full length) caspase. The antibodies can detect both the full length and the cleaved products (with the exception of those against cleaved caspase 7 and PARP, that only detect the cleaved products)

Similar articles

Cited by

References

    1. Burckhardt G, Di Sole F, Helmle-Kolb C. The Na+/H+ exchanger gene family. J Nephrol. 2002;15(5):S3–21. - PubMed
    1. Demaurex N, Grinstein S. Na+/H+ antiport: modulation by ATP and role in cell volume regulation. J Exp Biol. 1994;196:389–404. - PubMed
    1. Ritter M, Fuerst J, Woll E, et al. Na(+)/H(+)exchangers: linking osmotic dysequilibrium to modified cell function. Cell Physiol Biochem. 2001;11:1–18. - PubMed
    1. Brett CL, Donowitz M, Rao R. Evolutionary origins of eukaryotic sodium/proton exchangers. Am J Physiol Cell Physiol. 2005;288:C223–C239. - PubMed
    1. Chang AB, Lin R, Keith SW, Tran CV, Saier MH., Jr Phylogeny as a guide to structure and function of membrane transport proteins. Mol Membr Biol. 2004;21:171–181. - PubMed

MeSH terms