

Targeted discovery of novel human exons by comparative genomics
- PMID: 17989246
- PMCID: PMC2099585
- DOI: 10.1101/gr.7128207
Targeted discovery of novel human exons by comparative genomics
Abstract
A complete and accurate set of human protein-coding gene annotations is perhaps the single most important resource for genomic research after the human-genome sequence itself, yet the major gene catalogs remain incomplete and imperfect. Here we describe a genome-wide effort, carried out as part of the Mammalian Gene Collection (MGC) project, to identify human genes not yet in the gene catalogs. Our approach was to produce gene predictions by algorithms that rely on comparative sequence data but do not require direct cDNA evidence, then to test predicted novel genes by RT-PCR. We have identified 734 novel gene fragments (NGFs) containing 2188 exons with, at most, weak prior cDNA support. These NGFs correspond to an estimated 563 distinct genes, of which >160 are completely absent from the major gene catalogs, while hundreds of others represent significant extensions of known genes. The NGFs appear to be predominantly protein-coding genes rather than noncoding RNAs, unlike novel transcribed sequences identified by technologies such as tiling arrays and CAGE. They tend to be expressed at low levels and in a tissue-specific manner, and they are enriched for roles in motor activity, cell adhesion, connective tissue, and central nervous system development. Our results demonstrate that many important genes and gene fragments have been missed by traditional approaches to gene discovery but can be identified by their evolutionary signatures using comparative sequence data. However, they suggest that hundreds-not thousands-of protein-coding genes are completely missing from the current gene catalogs.
Figures
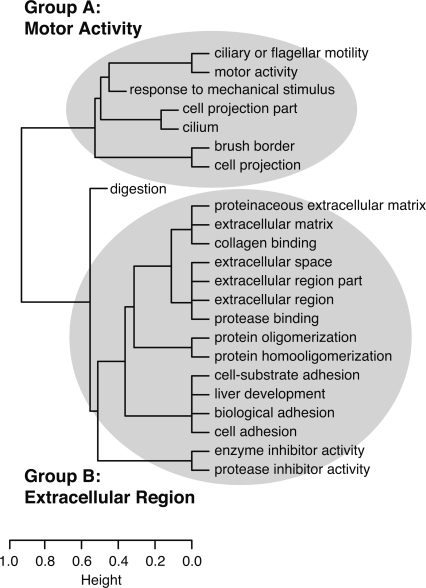
 (X)∩(Y)|/ min{|(X)|,|(Y)|}], where (C) denotes the (nonempty) set of NGFs assigned to GO category C.) As a result, GO categories associated with similar sets of NGFs group together in the dendrogram, even if these categories are not closely related in the GO hierarchy (such as “liver development” and “cell adhesion”). Here, two major groups of related categories are evident, broadly related to motor activity (Group A) and the extracellular region (Group B). (Dendrogram produced by the hclust function in R with method = “average.”)
References
-
- Adams M.D., Kerlavage A.R., Fields C., Venter J.C., Kerlavage A.R., Fields C., Venter J.C., Fields C., Venter J.C., Venter J.C. 3,400 new expressed sequence tags identify diversity of transcripts in human brain. Nat. Genet. 1993a;4:256–267. - PubMed
-
- Adams M.D., Soares M.B., Kerlavage A.R., Fields C., Venter J.C., Soares M.B., Kerlavage A.R., Fields C., Venter J.C., Kerlavage A.R., Fields C., Venter J.C., Fields C., Venter J.C., Venter J.C. Rapid cDNA sequencing (expressed sequence tags) from a directionally cloned human infant brain cDNA library. Nat. Genet. 1993b;4:373–380. - PubMed
-
- Adams M.D., Kerlavage A.R., Fleischmann R.D., Fuldner R.A., Bult C.J., Lee N.H., Kirkness E.F., Weinstock K.G., Gocayne J.D., White O., Kerlavage A.R., Fleischmann R.D., Fuldner R.A., Bult C.J., Lee N.H., Kirkness E.F., Weinstock K.G., Gocayne J.D., White O., Fleischmann R.D., Fuldner R.A., Bult C.J., Lee N.H., Kirkness E.F., Weinstock K.G., Gocayne J.D., White O., Fuldner R.A., Bult C.J., Lee N.H., Kirkness E.F., Weinstock K.G., Gocayne J.D., White O., Bult C.J., Lee N.H., Kirkness E.F., Weinstock K.G., Gocayne J.D., White O., Lee N.H., Kirkness E.F., Weinstock K.G., Gocayne J.D., White O., Kirkness E.F., Weinstock K.G., Gocayne J.D., White O., Weinstock K.G., Gocayne J.D., White O., Gocayne J.D., White O., White O., et al. Initial assessment of human gene diversity and expression patterns based upon 83 million nucleotides of cDNA sequence. Nature. 1995;377 (Suppl):3–174. - PubMed
-
- Ashburner M., Ball C.A., Blake J.A., Botstein D., Butler H., Cherry J.M., Davis A.P., Dolinski K., Dwight S.S., Eppig J.T., Ball C.A., Blake J.A., Botstein D., Butler H., Cherry J.M., Davis A.P., Dolinski K., Dwight S.S., Eppig J.T., Blake J.A., Botstein D., Butler H., Cherry J.M., Davis A.P., Dolinski K., Dwight S.S., Eppig J.T., Botstein D., Butler H., Cherry J.M., Davis A.P., Dolinski K., Dwight S.S., Eppig J.T., Butler H., Cherry J.M., Davis A.P., Dolinski K., Dwight S.S., Eppig J.T., Cherry J.M., Davis A.P., Dolinski K., Dwight S.S., Eppig J.T., Davis A.P., Dolinski K., Dwight S.S., Eppig J.T., Dolinski K., Dwight S.S., Eppig J.T., Dwight S.S., Eppig J.T., Eppig J.T., et al. Gene Ontology: Tool for the unification of biology. Nat. Genet. 2000;25:25–29. - PMC - PubMed
Publication types
MeSH terms
Grants and funding
LinkOut - more resources
Full Text Sources
Molecular Biology Databases