

Significant gene content variation characterizes the genomes of inbred mouse strains
- PMID: 17989247
- PMCID: PMC2099583
- DOI: 10.1101/gr.6754607
Significant gene content variation characterizes the genomes of inbred mouse strains
Abstract
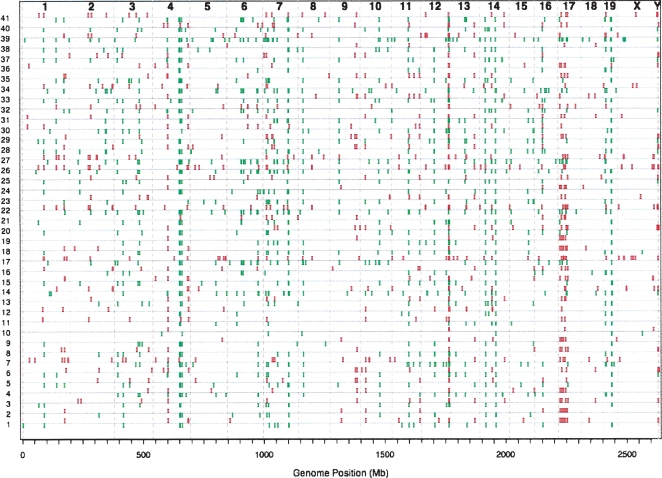
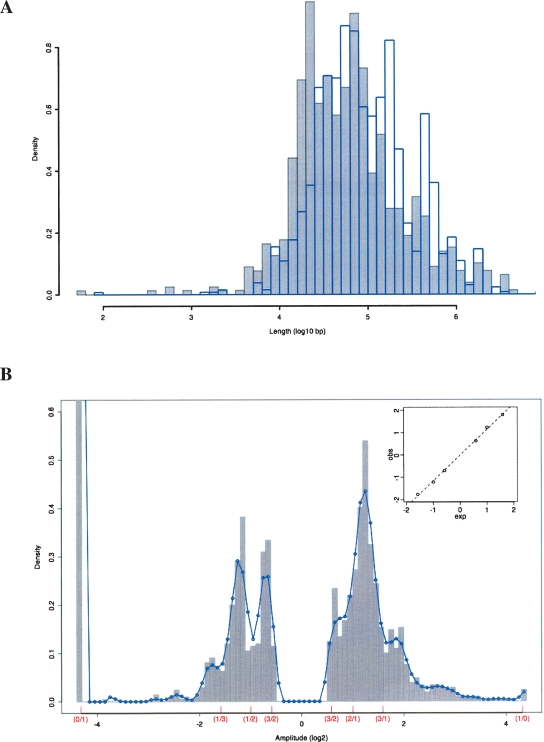
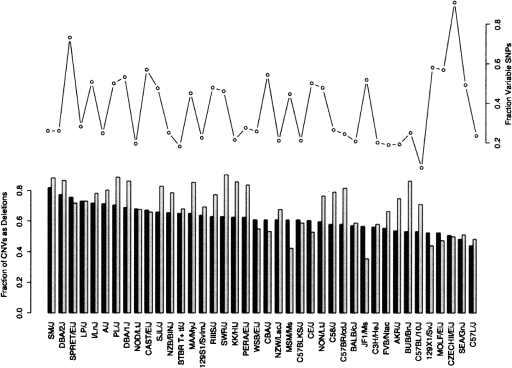
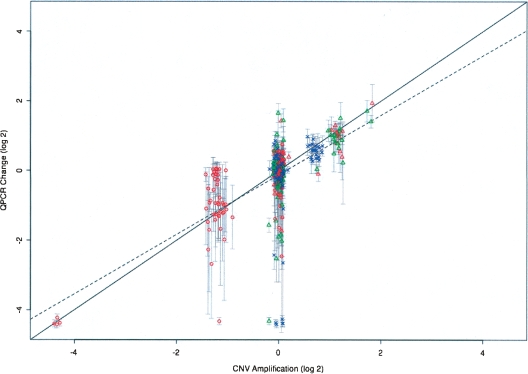
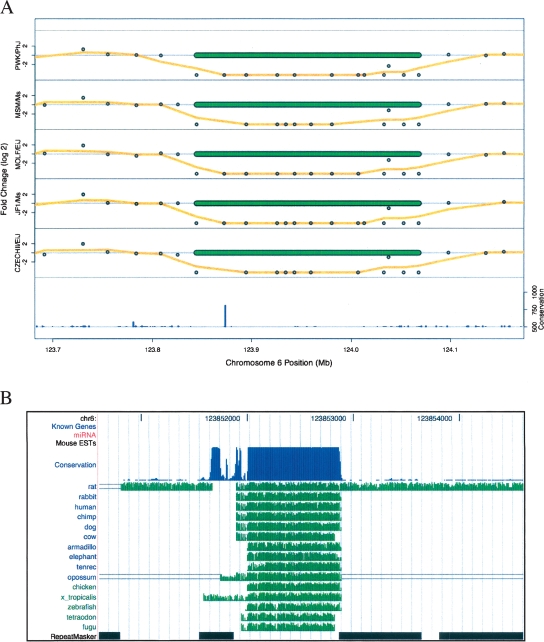
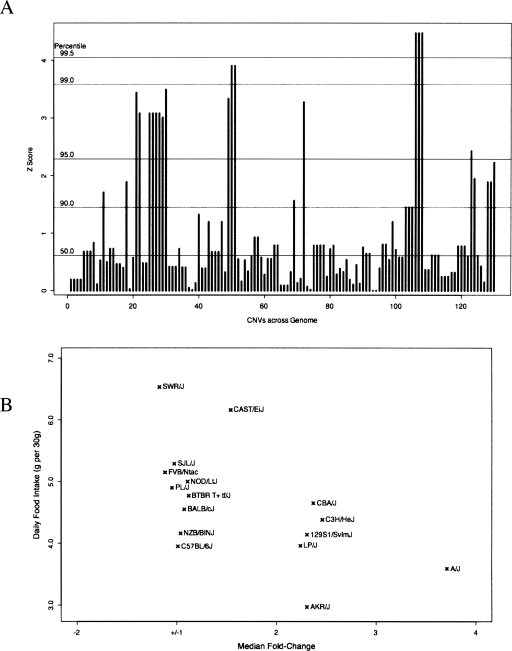
The contribution to genetic diversity of genomic segmental copy number variations (CNVs) is less well understood than that of single-nucleotide polymorphisms (SNPs). While less frequent than SNPs, CNVs have greater potential to affect phenotype. In this study, we have performed the most comprehensive survey to date of CNVs in mice, analyzing the genomes of 42 Mouse Phenome Consortium priority strains. This microarray comparative genomic hybridization (CGH)-based analysis has identified 2094 putative CNVs, with an average of 10 Mb of DNA in 51 CNVs when individual mouse strains were compared to the reference strain C57BL/6J. This amount of variation results in gene content that can differ by hundreds of genes between strains. These genes include members of large families such as the major histocompatibility and pheromone receptor genes, but there are also many singleton genes including genes with expected phenotypic consequences from their deletion or amplification. Using a whole-genome association analysis, we demonstrate that complex multigenic phenotypes, such as food intake, can be associated with specific copy number changes.
Figures
References
-
- Ashburner M., Ball C.A., Blake J.A., Botstein D., Butler H., Cherry J.M., Davis A.P., Dolinski K., Dwight S.S., Eppig J.T., Ball C.A., Blake J.A., Botstein D., Butler H., Cherry J.M., Davis A.P., Dolinski K., Dwight S.S., Eppig J.T., Blake J.A., Botstein D., Butler H., Cherry J.M., Davis A.P., Dolinski K., Dwight S.S., Eppig J.T., Botstein D., Butler H., Cherry J.M., Davis A.P., Dolinski K., Dwight S.S., Eppig J.T., Butler H., Cherry J.M., Davis A.P., Dolinski K., Dwight S.S., Eppig J.T., Cherry J.M., Davis A.P., Dolinski K., Dwight S.S., Eppig J.T., Davis A.P., Dolinski K., Dwight S.S., Eppig J.T., Dolinski K., Dwight S.S., Eppig J.T., Dwight S.S., Eppig J.T., Eppig J.T., et al. Gene Ontology: Tool for the unification of biology. The Gene Ontology Consortium. Nat. Genet. 2000;25:25–29. - PMC - PubMed
-
- Barrett M.T., Scheffer A., Ben-Dor A., Sampas N., Lipson D., Kincaid R., Tsang P., Curry B., Baird K., Meltzer P.S., Scheffer A., Ben-Dor A., Sampas N., Lipson D., Kincaid R., Tsang P., Curry B., Baird K., Meltzer P.S., Ben-Dor A., Sampas N., Lipson D., Kincaid R., Tsang P., Curry B., Baird K., Meltzer P.S., Sampas N., Lipson D., Kincaid R., Tsang P., Curry B., Baird K., Meltzer P.S., Lipson D., Kincaid R., Tsang P., Curry B., Baird K., Meltzer P.S., Kincaid R., Tsang P., Curry B., Baird K., Meltzer P.S., Tsang P., Curry B., Baird K., Meltzer P.S., Curry B., Baird K., Meltzer P.S., Baird K., Meltzer P.S., Meltzer P.S., et al. Comparative genomic hybridization using oligonucleotide microarrays and total genomic DNA. Proc. Natl. Acad. Sci. 2004;101:17765–17770. - PMC - PubMed
-
- Beck J.A., Lloyd S., Hafezparast M., Lennon-Pierce M., Eppig J.T., Festing M.F., Fisher E.M., Lloyd S., Hafezparast M., Lennon-Pierce M., Eppig J.T., Festing M.F., Fisher E.M., Hafezparast M., Lennon-Pierce M., Eppig J.T., Festing M.F., Fisher E.M., Lennon-Pierce M., Eppig J.T., Festing M.F., Fisher E.M., Eppig J.T., Festing M.F., Fisher E.M., Festing M.F., Fisher E.M., Fisher E.M. Genealogies of mouse inbred strains. Nat. Genet. 2000;24:23–25. - PubMed
-
- Behringer R.R., Nagy A., Gerstenstein M., Vintersten K., Nagy A., Gerstenstein M., Vintersten K., Gerstenstein M., Vintersten K., Vintersten K. Manipulating the mouse embryo: A laboratory manual. Cold Spring Harbor Laboratory Press; Cold Spring Harbor, NY: 2003.
-
- Birney E., Andrews T.D., Bevan P., Caccamo M., Chen Y., Clarke L., Coates G., Cuff J., Curwen V., Cutts T., Andrews T.D., Bevan P., Caccamo M., Chen Y., Clarke L., Coates G., Cuff J., Curwen V., Cutts T., Bevan P., Caccamo M., Chen Y., Clarke L., Coates G., Cuff J., Curwen V., Cutts T., Caccamo M., Chen Y., Clarke L., Coates G., Cuff J., Curwen V., Cutts T., Chen Y., Clarke L., Coates G., Cuff J., Curwen V., Cutts T., Clarke L., Coates G., Cuff J., Curwen V., Cutts T., Coates G., Cuff J., Curwen V., Cutts T., Cuff J., Curwen V., Cutts T., Curwen V., Cutts T., Cutts T., et al. An overview of Ensembl. Genome Res. 2004;14:925–928. - PMC - PubMed
Publication types
MeSH terms
Associated data
- Actions
LinkOut - more resources
Full Text Sources
Other Literature Sources
Molecular Biology Databases
Miscellaneous