Comparative Study
. 2007 Nov 7;27(45):12176-89.
doi: 10.1523/JNEUROSCI.3761-07.2007.

Neural ensembles in CA3 transiently encode paths forward of the animal at a decision point

Affiliations
Comparative Study

Neural ensembles in CA3 transiently encode paths forward of the animal at a decision point

Adam Johnson et al. J Neurosci. .

Abstract

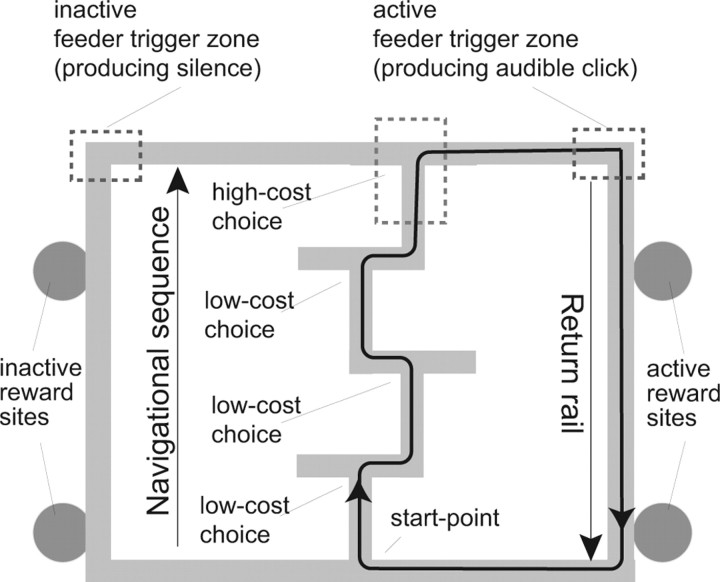
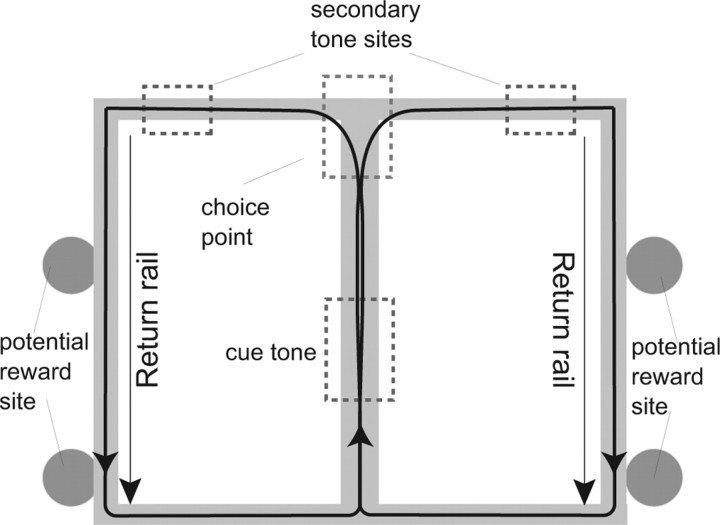
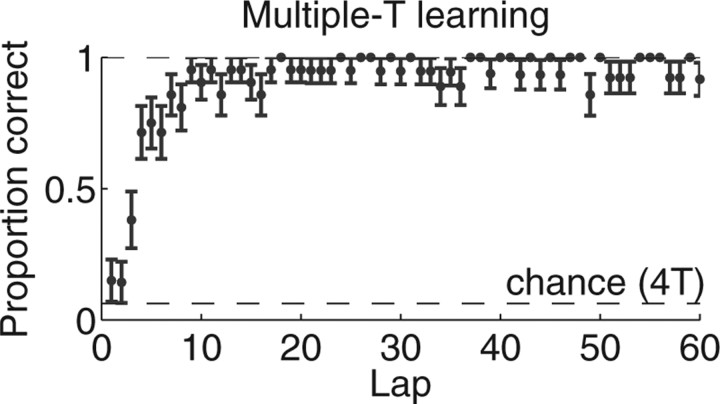
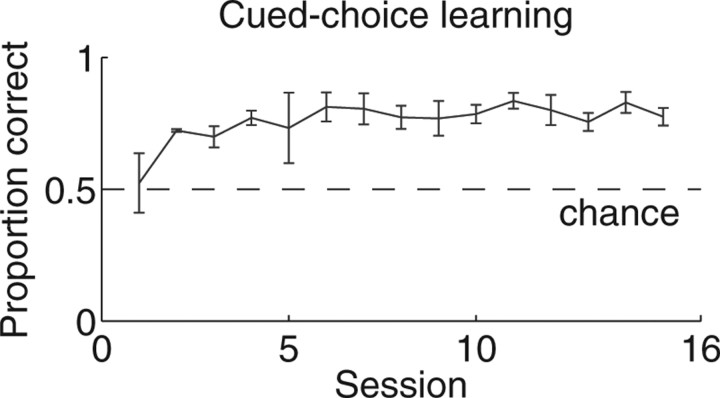
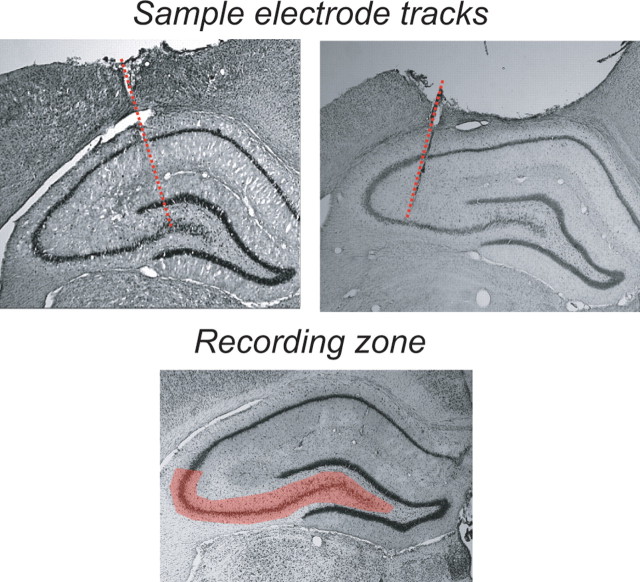
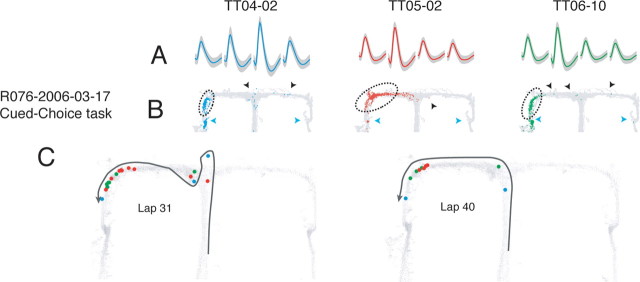
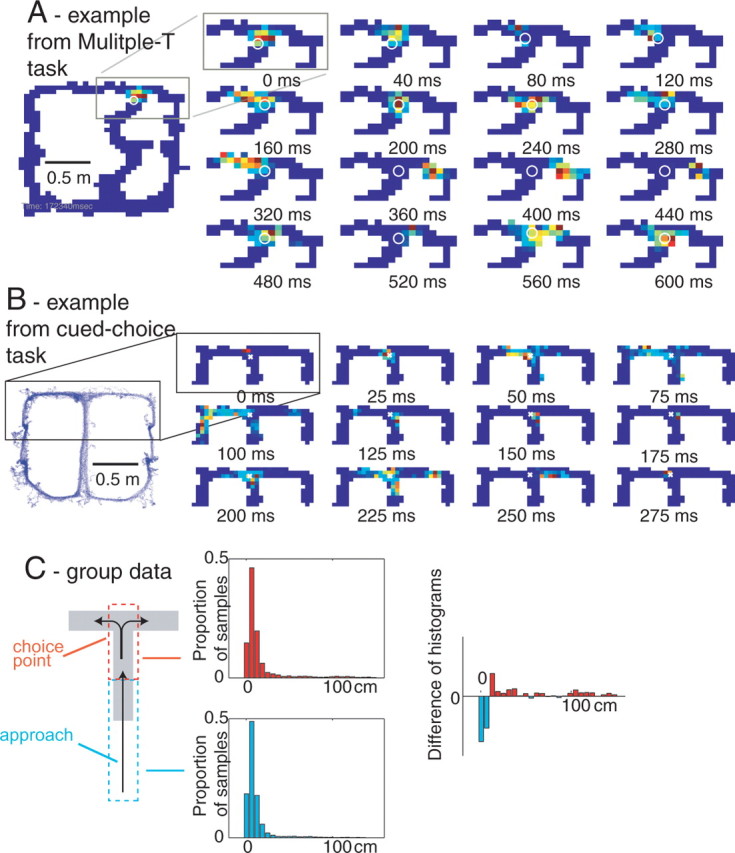
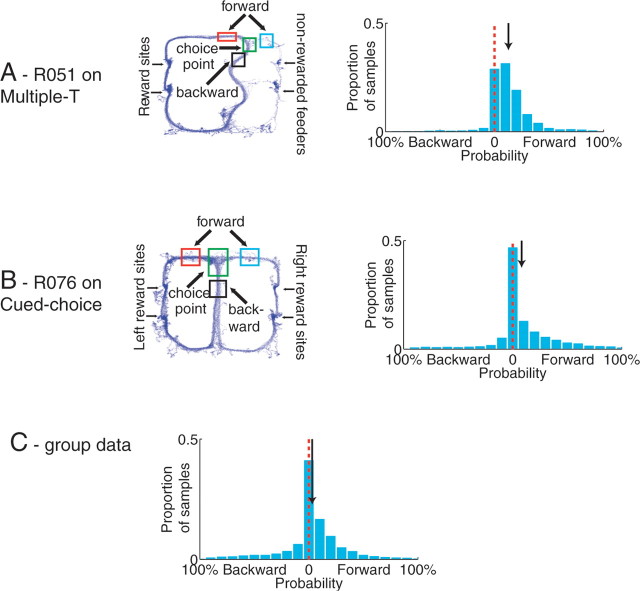
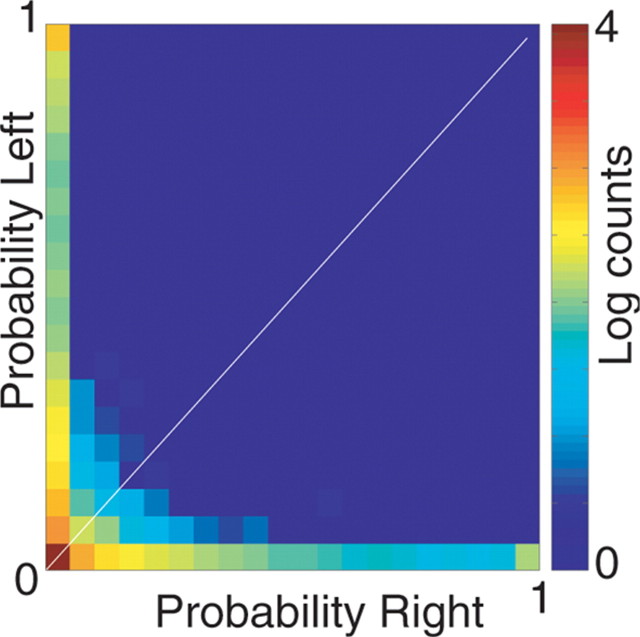
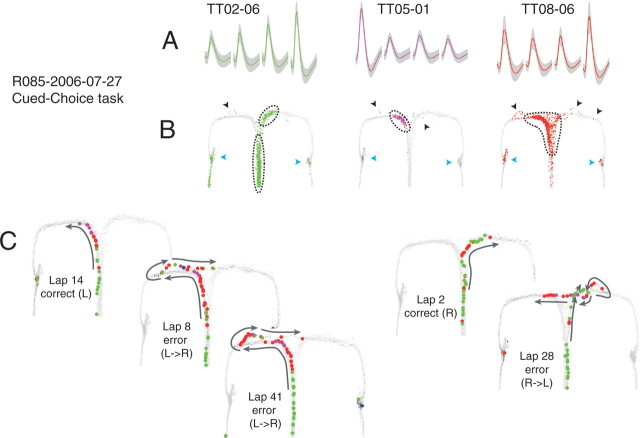
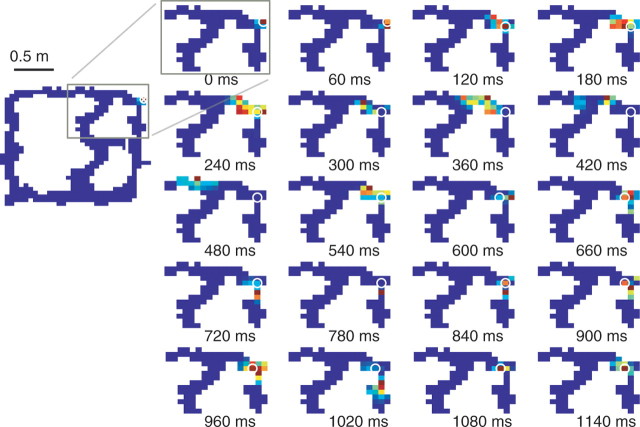
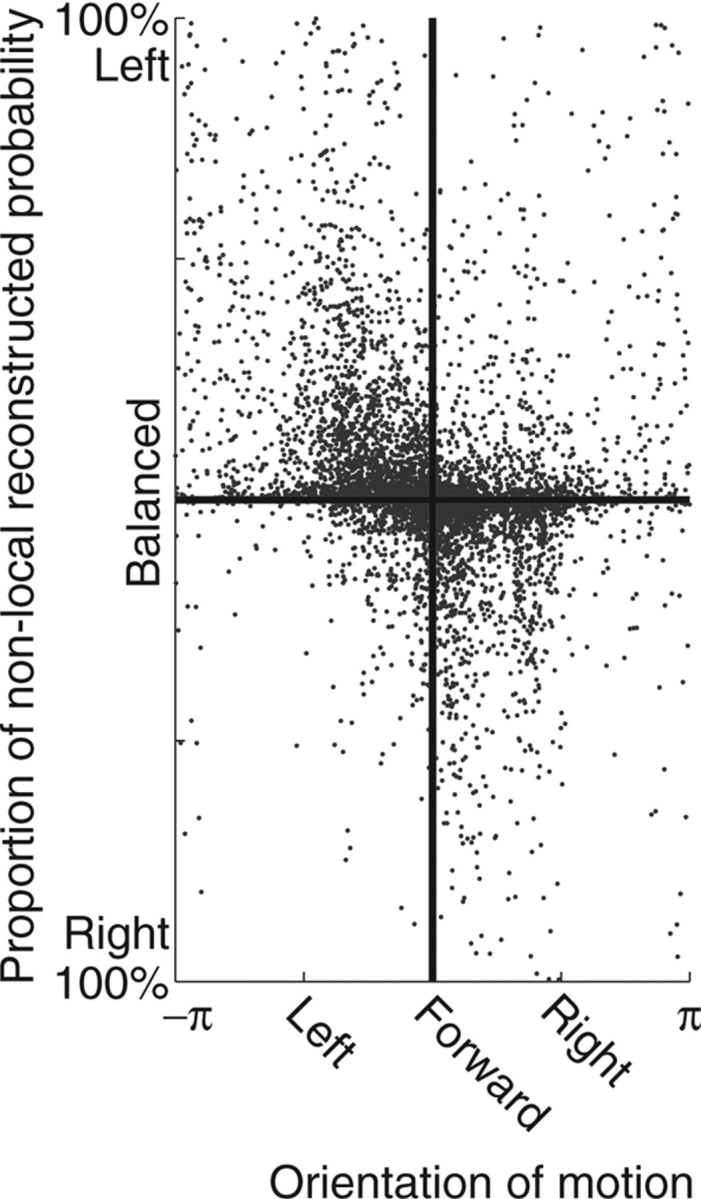
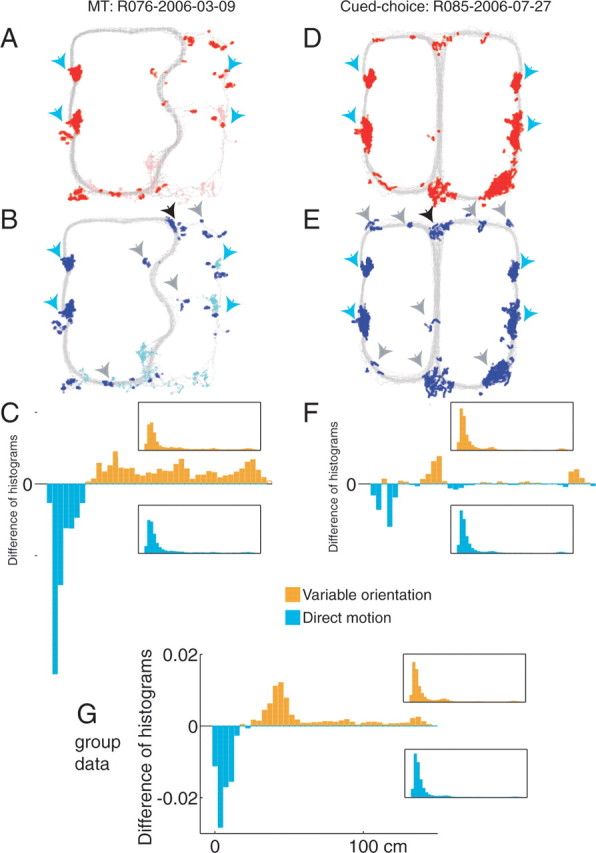
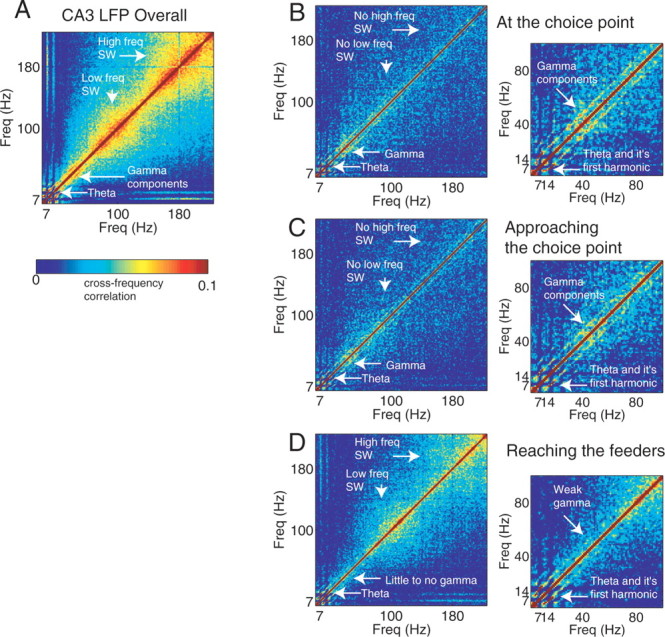
Neural ensembles were recorded from the CA3 region of rats running on T-based decision tasks. Examination of neural representations of space at fast time scales revealed a transient but repeatable phenomenon as rats made a decision: the location reconstructed from the neural ensemble swept forward, first down one path and then the other. Estimated representations were coherent and preferentially swept ahead of the animal rather than behind the animal, implying it represented future possibilities rather than recently traveled paths. Similar phenomena occurred at other important decisions (such as in recovery from an error). Local field potentials from these sites contained pronounced theta and gamma frequencies, but no sharp wave frequencies. Forward-shifted spatial representations were influenced by task demands and experience. These data suggest that the hippocampus does not represent space as a passive computation, but rather that hippocampal spatial processing is an active process likely regulated by cognitive mechanisms.


Figures

Figure 1.
Figure 1.
The multiple-T maze. The task consists of four T choice points with food reward available at two sites on each return rail. Only feeders on one side of the track were rewarded in each session.
Figure 2.
Figure 2.
The cued-choice maze. The task consists of a single T turn with food reward available at two sites on each return rail. On each lap, a cue tone on the center stem (red dashed box) signaled whether the left or right arm would be rewarded. If and only if the rat made the correct turn, a matching tone would play at the T arm (blue dashed boxes).
Figure 3.
Figure 3.
Learning on the multiple-T task. Within each session, the probability of completing a lap without an error started not significantly different from chance and increased quickly over the initial laps. The mean and SE are shown for 21 novel sessions over six animals.
Figure 4.
Figure 4.
Learning on the cued-choice task. Over 15 sessions, the probability of making the correct choice increased significantly. The mean and SE are shown for both left and right choices over two animals.
Figure 5.
Figure 5.
Recording sites came from the CA3 region of hippocampus.
Figure 6.
Figure 6.
Extrafield firing in hippocampal place cells at the choice point on the cued-choice task. A, Average waveforms (gray; SD) for three simultaneously recorded, well isolated place cells. B, Spatial activity of each cell across the full session. The light gray lines indicate the rat's positions. Colored dots indicate the rat's position at the time of a spike. Blue triangles indicate feeder locations; black triangles indicate extrafield spiking. Dotted lines delineate place field boundaries. Place fields were defined as a contiguous region with an average firing rate exceeding 20% peak field rate (Huxter et al., 2003; Leutgeb et al., 2004). Note the sparseness preceding the place field in the red cell (TT05-02) in B. It is possible that some of this sparse early activity is also extrafield firing. Classically defined place fields are included for illustration only; all spikes were included in all analyses. C, Place cell activity on specific trajectories. Light gray lines again indicate animal positions across the full session. Colored dots show animal positions at the time of cell spiking. Black trajectory arrows indicate direction of motion along the trajectory. Note that extrafield firing primarily occurs at the choice point.
Figure 7.
Figure 7.
Forward-shifted neural representations at the choice point. A, B, The representation closely tracked the rat's position through the stem of the final T choice point for both the multiple-T (A) and cued-choice tasks (B). When the rat paused at the final choice point, the representation moved ahead of the animal and sampled each arm. The representation intensity is shown in pseudocolor (red, high probability; blue, low probability) and the animal's position shown as a white open circle. C, Distribution of distances between reconstructed location and actual location for the choice point (red, top) and for the immediately preceding duration-matched approach to the choice point (cyan, bottom). The approach contains more local representations whereas the choice point contains more nonlocal representations. The medians of the two distributions are different (Wilcoxon rank-sum test, p < 10−10).
Figure 8.
Figure 8.
The nonlocal reconstruction events occurring at the choice point are forward of the animal. A, B, Specific examples from two data sets. Three regions of interest were defined (to the left of the animal, to the right of the animal, and behind the animal). Proportions of reconstructed probability p(x|S) for each region were measured. Red line indicates 0, and the black arrow indicates the median. The median was significantly >0 in all measured data sets. A, Multiple-T. B, Cued-choice. C, Joint probability between forward probability intensity and backward probability intensity (log units). Note the strong preference for forward over backward.
Figure 9.
Figure 9.
The nonlocal reconstruction events occurring at the choice point are concentrated in each arm separately. Joint probability of probability intensity concentrated on each arm (log units). Note the strong preference for one arm over the other with no joint probability in both directions simultaneously.
Figure 10.
Figure 10.
Extrafield firing in hippocampal place cells during error correction on the cued-choice task. A, Average waveforms (gray, SD) for three simultaneously recorded, well isolated place cells. B, Spatial activity of each cell across the full session. The light gray lines indicate the rat's positions. Colored dots indicate the rat's position at the time of a spike. Blue triangles indicate feeder locations; black triangles indicate extrafield spiking. Dotted lines delineate place field boundaries. Place fields were defined as a contiguous region with an average firing rate exceeding 15% peak field rate (Huxter et al., 2003; Leutgeb et al., 2004). C, Place cell activity on specific trajectories. Light gray lines again indicate animal positions across the full session. Colored dots show animal positions at the time of cell spiking. Black trajectory arrows indicate the direction of motion along the trajectory. Note that extrafield firing sometimes occurs before the animal turns back toward the choice point on reversals.
Figure 11.
Figure 11.
Error correction in the hippocampal neural ensemble. Again, the representation closely tracked the rat's position from the choice point to the feeder trigger zone. The rat turned back toward the choice point and the representation moved into the opposite maze arm. The representation intensity is indicated by color (red, high probability; blue, low probability), and the actual position of the animal is indicated by an open circle. Panels are arranged from left to right and top to bottom in 60 ms intervals.
Figure 12.
Figure 12.
Direction of nonlocal reconstructed representation as a function of the orientation of motion of the animal. For all samples at the choice point, the direction of nonlocal reconstruction was measured as the proportion to the left of the animal minus the proportion to the right of the animal. Although there was a significant correlation (p(slope = 0) ≤ 10−10), there were also samples reaching left while the animal moved right and vice versa.
Figure 13.
Figure 13.
Reconstruction error is more nonlocal at locations where animals show a highly variable orientation of motion. A, D, Locations where the animal paused. Gray dots indicate all locations sampled during the full session; red dots indicate locations where the animal paused. Lighter color dots in A indicate pauses occurring in the last two laps, during which the animal no longer actively searched for food. B, E, Locations where the animal showed a high variability of orientation of motion. Lighter color dots in B indicate variable orientations occurring in the last two laps, during which the animal no longer actively searched for food. C, F, Difference between histograms of reconstruction error distance during samples with variable orientation of motion (B, E, blue dots) and during the rest of the session. Reconstruction distance was greater during samples with variable orientation of motion (Wilcoxon rank-sum test, p < 10−10, C; p < 0.00005, F). A–C, Multiple-T. D–F, Cued choice. Blue triangles indicate feeder locations. Black triangles indicate the choice point studied in Figure 5. Gray triangles indicate other pause locations during which animals spent time varying their orientation of motion, including the reversal locations studied in Figure 11. G, Group data showing that the tendency to show an increased nonlocality of reconstruction during variable orientation motion is a general property of the entire data set.
Figure 14.
Figure 14.
CA3 LFP during choice point behavior. A–E, Sample local field potential during a pause at the choice point (Fig. 5, supplemental movie 1, available at www.jneurosci.org as supplemental material). A, Absolute velocity. B, Raw local field potential trace. C, Gamma power (filtered at 30–80 Hz) z scores based on the distribution drawn from the full session. D, Sharp-wave ripple-power (filtered at 100–250 Hz) z-scores based on the distribution drawn from the full session. E, Gray dots indicate all positions sampled by the animal over the entire session. Colored dots indicate the path of the animal sampled during time corresponding to LFP data on the left. Colors indicate the passage of time and are consistent between left and right panels.
Figure 15.
Figure 15.
CA3 LFP during choice-point behavior and other maze areas. A, Average cross-frequency correlations from all available 40 min sessions. In these plots, important frequencies show up as high-correlated blocks (Masimore et al., 2004). Data include additional sessions from which spikes were not available (data averaged over 16 sessions from 3 animals). Note the clear indications of theta (at 7–10 Hz) and the low-frequency (100–150 Hz) and high-frequency (200 Hz) sharp waves in the overall plot (left). B, Average cross-frequency correlations at choice point times. C, Average cross-frequency correlations at stem times. D, Average cross-frequency correlations at feeder arrival. Note that local field potentials at the choice point and stem include gamma (30–80 Hz) but no low- or high-frequency sharp waves. This contrasts with feeder times, which display decreased theta and gamma correlations, but strong correlations at low- and high-frequency sharp-wave ripple frequencies.
Figure 16.
Figure 16.
Phase relationships between sweeps and theta. A, Example local field potential showing the raw (blue) and theta-filtered (red) local field potential surrounding a 200 ms sweep. Note how the sweep spans several theta cycles. B, Distribution of LFP aligned to start times from all sweeps occurring within one session R076-2006-03-09. Start time corresponds to the green line. All samples are shown in blue; the average is shown in red. C, Distribution of filtered-LFP signals aligned to start times from all sweeps occurring within that same session. D, E, Equivalent plots showing LFP alignment of sweep stop times. F, Group data for all sessions showing histogram of distribution of theta phase of sweep start times. G, Group data for all sessions showing histogram of distribution of theta phase of sweep stop times.
Figure 17.
Figure 17.
Choice point behavior and neural activity changes as a function of task and experience. Both time in the center stem and nonlocal activity decreased with experience on the multiple-T task; no such changes were observed on the cued-choice task. Plots show spatial neural activity at the choice point (colors) localized to the choice point (green), the left arm (red), or the right arm (blue). Laps increase from top to bottom. Data are presented as time series until exit from the choice point in 40 ms samples. A, B, Multiple-T. C, D, Cued-choice task. E, Group data. LR balance was defined as the mean absolute difference between the probabilities in the left and right arm areas for each lap. The LR balance was significantly increased only on the first five laps of the multiple-T task. The locality was the mean probability within the central choice point area for each lap. For details, see Materials and Methods.

References

    1. Ainge JA, van der Meer MA, Wood ER. Disparity between sequence-dependent hippocampal activity and hippocampal lesion effects on a continuous t-maze task. Soc Neurosci Abstr. 2005;31:776–13.
    1. Ainge JA, Tamosiunaite M, Woergoetter F, Dudchenko P. Prospective coding in CA1 hippocampal place cells on a maze with multiple choice points. Soc Neurosci Abstr. 2006;32:68–20. - PMC - PubMed
    1. Ainge JA, Tamosiunaite M, Woergoetter F, Dudchenko PA. Hippocampal CA1 place cells encode intended destination on a maze with multiple choice points. J Neurosci. 2007a;27:9769–9779. - PMC - PubMed
    1. Ainge JA, van der Meer MA, Langston RF, Wood ER. Exploring the role of context-dependent hippocampal activity in spatial alternation behavior. Hippocampus. 2007b;17:988–1002. - PubMed
    1. Bower MR, Euston DR, McNaughton BL. Sequential-context-dependent hippocampal activity is not necessary to learn sequences with repeated elements. J Neurosci. 2005;25:1313–1323. - PMC - PubMed

Publication types