Comparative Study
. 2007 Nov 7;27(45):12242-54.
doi: 10.1523/JNEUROSCI.3753-07.2007.

Stereotypical bouton clustering of individual neurons in cat primary visual cortex

Affiliations
Comparative Study

Stereotypical bouton clustering of individual neurons in cat primary visual cortex

Tom Binzegger et al. J Neurosci. .

Abstract

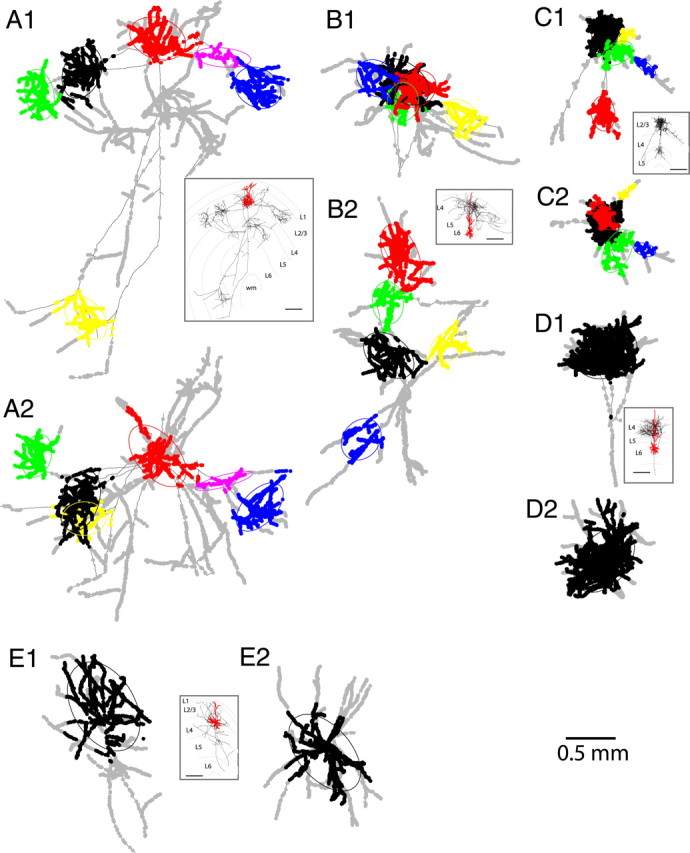
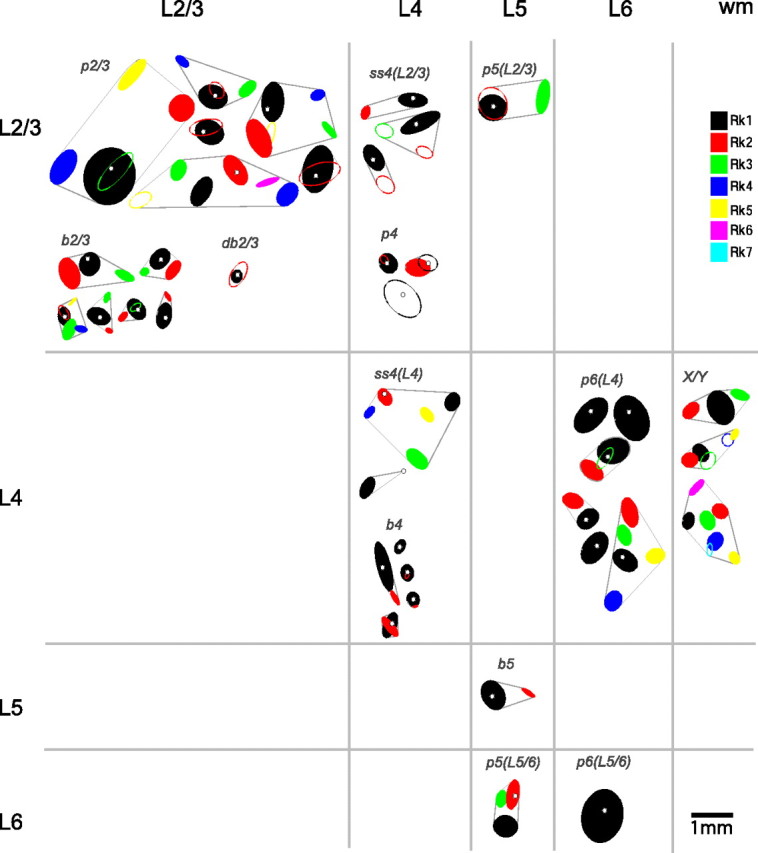
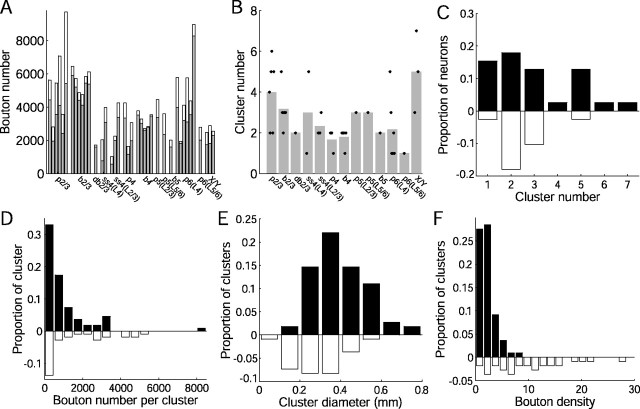
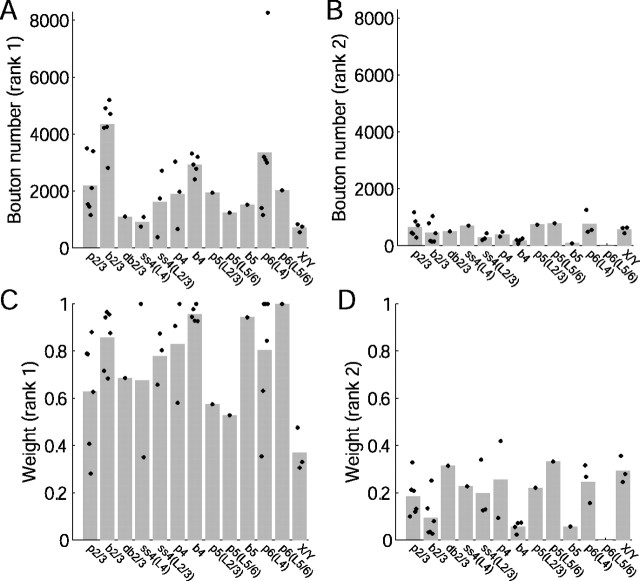
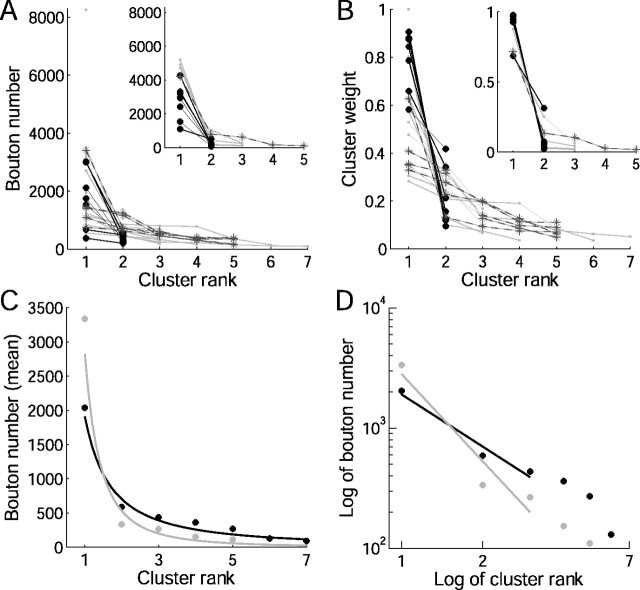
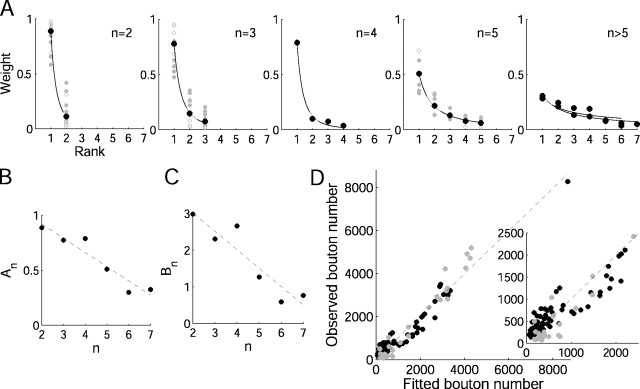
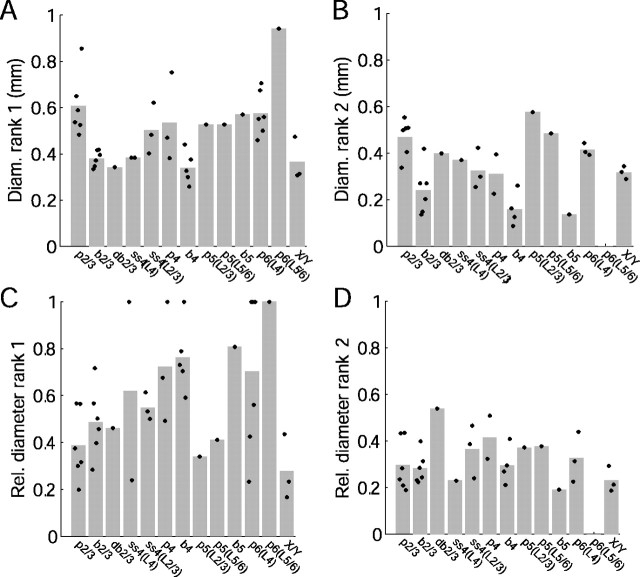
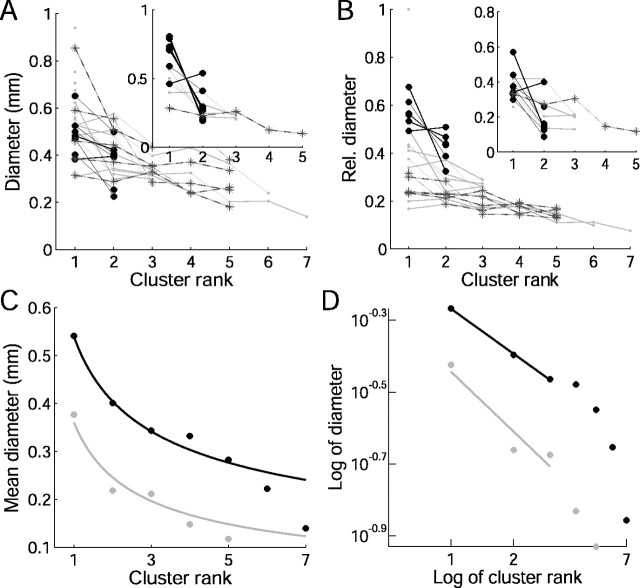
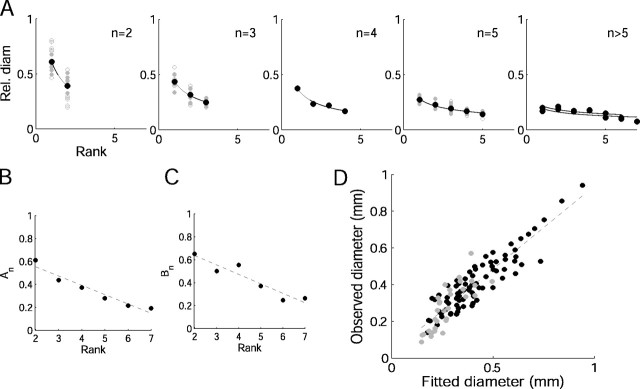
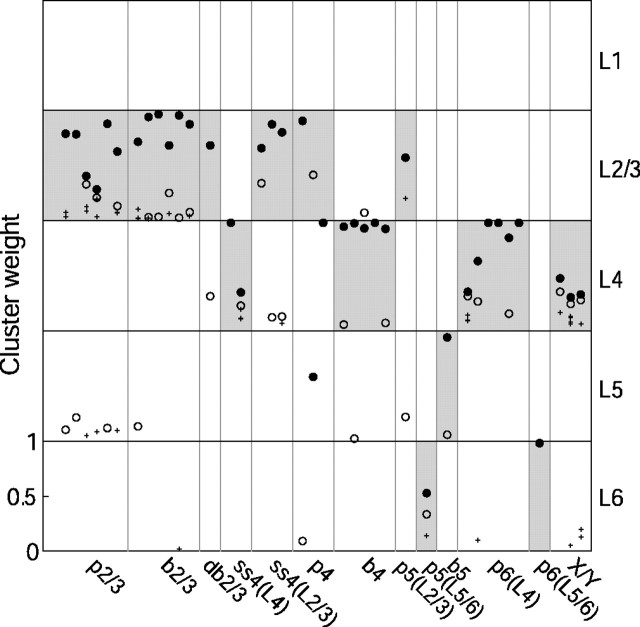
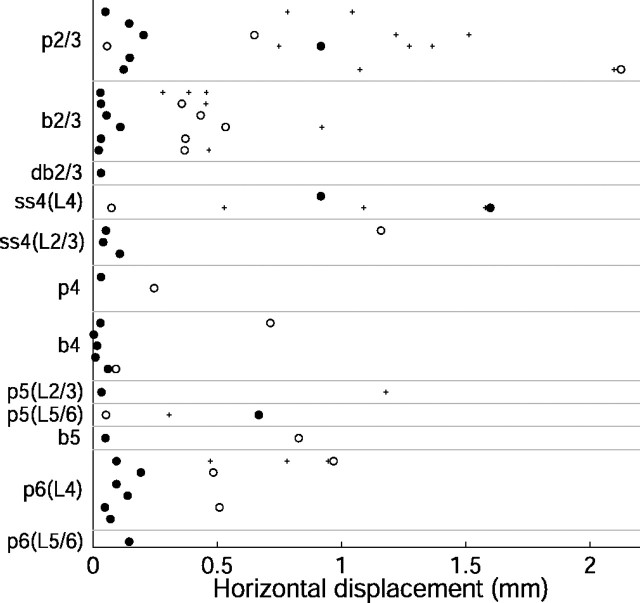
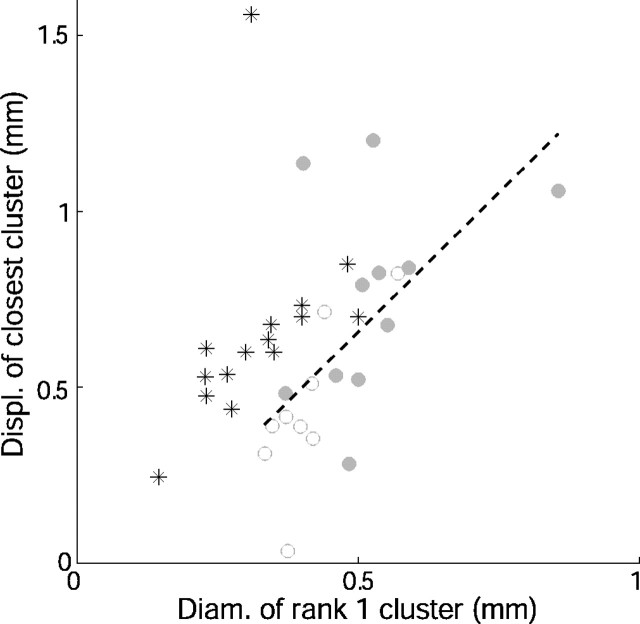
In all species examined, with the exception of rodents, the axons of neocortical neurons form boutons in multiple separate clusters. Most descriptions of clusters are anecdotal, so here we developed an objective method for identifying clusters. We applied a mean-shift cluster-algorithm to three-dimensional reconstructions of 39 individual neurons and three thalamic afferents from the cat primary visual cortex. Both spiny (20 of 26) and smooth (7 of 13) neurons formed at least two distinct ellipsoidal clusters (range, 2-7). For all cell types, cluster formation is heterogenous, but is regulated so that cluster size and the number of boutons allocated to a cluster equalize with increasing number of clusters formed by a neuron. The bouton density within a cluster is inversely related to the spatial scale of the axon, resulting in a four times greater density for smooth neurons than for spiny neurons. Thus, the inhibitory action of the smooth neurons is much more concentrated and focal than the excitatory action of spiny neurons. The cluster with the highest number of boutons (primary cluster) was typically located around or above the soma of the parent neuron. The distance to the next cluster was proportional to the diameter of the primary cluster, suggesting that there is an optimal distance and spatial focus of the lateral influence of a neuron. The lateral spread of clustered axons may thus support a spoke-like network architecture that routes signals to localized sites, thereby reducing signal correlation and redundancy.


Figures

Figure 1.
Figure 1.
Examples of bouton clouds with identified clusters. The bouton locations are shown in coronal view (A1–E1) and top view (A2–E2). Bouton clouds are from reconstructed pyramidal cells in layers 2/3 (A), layer 4 (E), and layer 6 (B, D) and from a basket cell in layers 2/3 (C). The clusters are indicated with different colors (black, red, green, blue and yellow, etc., in order of decreasing bouton number). Colored ellipses indicate the contours of the projected 2-ellipsoids associated with each cluster. Gray dots indicate boutons that are not in a cluster. All pictures are drawn on the same scale. Insets, Coronal view of the axon (black) and dendrites (red) of each neuron, indicating the position of the neuron in relation to the cortical layers (gray curved lines).
Figure 2.
Figure 2.
Summary diagram showing the cluster for all neurons in top view. Cluster outlines are indicated by ellipses (projected 2-ellipsoids), and all clusters belonging to a neuron are delineated by a gray polygon. Neurons of the same type are grouped (cell type label indicated above each group). The position of the neuron in the table indicates the layer of soma (vertical) and the primary layer of axonal innervation (horizontal). Filled ellipses are clusters in the primary layer of axonal innervation, empty ellipses indicate clusters in other layers. Color code indicates the cluster rank. White dots indicate the position of the soma relative to the clusters. Cluster location and orientation were corrected for curvature of cortical layers. L2/3-L6, Cortical layers 2/3–6; b2/3, b4, b5, basket cells in layer 2/3, 4, and 5; db2/3, double bouquet cell in layer 2/3; p2/3, p4, p5, p6, pyramidal cells in layer 2/3, 4, 5, and 6; ss4, spiny stellate cells in layer 4. Spiny stellate cells and pyramidal cells in layer 5 and 6 were further distinguished by the primary layer of the axonal innervation [ss4(L4), ss4(L2/3), p5(L2/3), p5(L5/6), p6(L4), and p6(L5/6)]. X/Y, Thalamic afferents of type X and Y.
Figure 3.
Figure 3.
Basic cluster measurements. A, Total number of boutons per neuron (total bar) and the number of boutons belonging to a cluster (gray bars). B, Cluster number per neuron (dots) and averaged over the neurons in the same cell type (gray bars). C, Proportion of excitatory neurons (black bars) and inhibitory neurons (negative white bars) forming a given number of clusters. D–F, Proportion of clusters from excitatory neurons (black bar) and inhibitory neurons (negative white bars) of a given bouton number (D, bin size, 500 boutons), diameter (E; bin size, 0.1 mm), and bouton density (F; bin size, 1.5 boutons per 50 μm3). Proportions are taken relative to the total pool of clusters.
Figure 4.
Figure 4.
Bouton number in rank 1 and rank 2 clusters. A, B, For each neuron (dots), the number of boutons in rank 1 (A) and rank 2 cluster (B) is shown. Gray bars indicate cell type averages. C, D, For each neuron (dots), the cluster weight of rank 1 (C) and rank 2 (D) is shown. Gray bars indicate cell type averages.
Figure 5.
Figure 5.
Comparison of the bouton number in rank k clusters between individual neurons. A, B, For each excitatory neuron and inhibitory neuron (inset), the bouton number per cluster (A) and the cluster weight (B) is shown as a function of rank k. Closed black circles connected by black lines indicate neurons with two clusters; stars connected by dark gray lines indicate neurons with five clusters; and light gray lines are neurons with other cluster numbers. C, Bouton number per cluster averaged over clusters of equal rank, calculated separately for excitatory neurons (black dots) and inhibitory neurons (gray dots). Black and gray curves are fitted power functions of the form y = αxβ. Estimates of the scaling coefficient α and exponent β are based on the best fit of a straight line to the first three data points in log-log space (D; r2 > 0.90). For the excitatory neurons (black line), α = 1901 and β = −1.44; for the inhibitory neurons (gray line), α = 2820 and β = −2.41.
Figure 6.
Figure 6.
Bouton allocation to clusters depends on cluster number per neuron. A, Cluster weight (gray closed circles from excitatory neurons; gray open circles from inhibitory neurons) as a function of rank, plotted separately so that neurons forming the same number of clusters (n, indicated on the top) are superimposed in a plot. Black dots indicate the rank-wise average; solid black line indicates a fitted power function AnkBn to the rank-wise mean values of neurons forming n clusters. The coefficient An was restricted so that the sum of AnkBn over the clusters k always equated 1. B, Fitted coefficients An plotted as a function of cluster number n. The dashed line indicates the best fit through the points n ≥ 2 (offset a = 1.18, slope b = −0.13; r2 = 0.90). C, Fitted exponents Bn plotted as a function of cluster number n. The dashed line indicates the best fit through the points n ≥ 2 (a = 4.03, b = −0.50; r2 = 0.85). D, Comparison of the observed bouton number per cluster, and the bouton number per cluster based on the fitted power functions Ãnkn with Ãn and n given by the fitted lines in B and C. The dashed line indicates the best fit (a = 9.66, b = 0.99; r2 = 0.94). Black dots indicate clusters of excitatory neurons, and gray dots indicate clusters from inhibitory neurons. Inset, Magnified version of the lower left corner of the graph.
Figure 7.
Figure 7.
Diameter of rank 1 and rank 2 clusters. A, B, Shown is for reach neuron (dots) the diameter for rank 1 (A) and rank 2 (B) clusters. Gray bars indicate cell type averages. C, D, For each neuron (dots), the relative diameter for rank 1 (C) and rank 2 (D) clusters is shown. Gray bars indicate cell type averages.
Figure 8.
Figure 8.
Comparison of diameters of rank k clusters between individual neurons. A, B, For each excitatory neuron and inhibitory neuron (inset), the cluster diameter (A) and relative cluster diameter (B) is shown as a function of rank k. Closed black circles connected by black lines indicate neurons with two clusters, stars connected by dark gray lines indicate neurons with five clusters, and light gray lines are neurons with other cluster numbers. C, Cluster diameter averaged over clusters of equal rank, calculated separately for excitatory neurons (black dots) and inhibitory neurons (gray dots). Black and gray curves are fitted power functions of the form y = αxβ. Estimates of the scaling coefficient α and exponent β are based on the best fit of a straight line to the first three data points in log-log space (D; r2 > 0.90). For the excitatory neurons (black line), α = 0.54 and β = −0.42. For the inhibitory neurons (gray line), α = 0.36 and β = −0.55.
Figure 9.
Figure 9.
Cluster diameter depends on cluster number per neuron. A, Relative cluster diameter (gray closed circles from excitatory neurons; gray open circles from inhibitory neurons) as a function of cluster rank, plotted separately so that neurons forming the same number of clusters (n) are superimposed in a plot. Black dots indicate the rank-wise average. The solid black line indicates a fitted power function AnkBn to the rank-wise mean values of neurons forming n clusters. The coefficient An was restricted so that the sum AnkBn over the clusters k always equated 1. B, Fitted coefficients An plotted as a function of cluster number n. The dashed line indicates the best fit through the points n ≥ 2 (a = 0.72, b = −0.08; r2 = 0.94). C, Fitted exponents plotted as a function of cluster number n. Stippled line indicates the best fit through the points n ≥ 2 (a = 0.80, b = −0.08; r2 = 0.88). D, Comparison of the observed cluster diameter, and the cluster diameter based on the fitted power functions Ãnkn with Ãn and n given by the fitted lines in B and C. The dashed line indicates the best fit (a = 0.03, b = 0.91; r2 = 0.82).
Figure 10.
Figure 10.
Vertical organization of clusters. For each neuron (x-axis), the cluster weights are indicated (left vertical axis) and grouped by cortical layer (right vertical axis). Horizontal lines indicate layer borders, and vertical gray lines separate cell types. Each layer has the same scale (0–1) measuring the cluster weight, as is indicated for layer 6. Black dots indicate rank 1 clusters, open circles rank 2 cluster, and clusters with rank >2 are indicated by a small cross. Gray shaded region indicates for each cell type the primary layer of axonal innervation.
Figure 11.
Figure 11.
Horizontal organization of clusters in the primary layer of innervation. For each neuron (y-axis), the horizontal displacement of the clusters from cell origin is shown (x-axis). Gray horizontal lines separate different cell types. Closed circles indicate rank 1 clusters, open circles rank 2 clusters, and clusters with rank >2 are indicated by a small cross. Note that some neurons do not have a rank 1 or rank 2 cluster in the primary layer of innervation. Thalamic afferents were excluded.
Figure 12.
Figure 12.
Neurons operate on different spatial scales. Shown is the scatterplot of diameters of rank 1 clusters in the primary layer of axonal innervation and their horizontal displacement to the next closest cluster in the primary layer of axonal innervation. The correlation is significant (a = −0.13, b = 1.58; r2 = 0.38; p < 0.01). Gray closed dots indicate excitatory neurons, and gray open dots indicate inhibitory neurons. Black stars indicate average measurements from various species and areas (Rockland et al., 1982; Luhmann et al., 1986; Burkhalter, 1989; Kaas et al., 1989; Blasdel, 1992; Kisvárday and Eysel, 1992; Yoshioka et al., 1992; Amir et al., 1993; Lund et al., 1993; Levitt et al., 1994; Fujita and Fujita, 1996; Kisvárday et al., 1997; Malach et al., 1997; Fitzpatrick et al., 1998).
Figure 13.
Figure 13.
A generative model of cluster formation that predicts the observed dependence of cluster weights with the number of clusters per neuron. New clusters are formed by branching off a fraction γ of boutons from one of the existing clusters. A, The left column shows the arrangement where always the youngest cluster is split to form a new cluster, which in turn becomes the youngest cluster (linear chain). The right column shows the arrangement where always the oldest cluster is split (spokes). The oldest cluster is indicated by a black closed disc. Arrows indicate axonal paths between clusters. B, C, Cluster weights for neurons forming 2–7 clusters in the linear chain (B) and spokes arrangement (C) for γ = 0.2. D, Comparison of spoke arrangement with the cluster data. Each subfigure shows the observed cluster weights for neurons forming two to seven clusters (dots). Gray lines indicate the fitted power functions. Subfigures were copied from Figure 6A. Black lines indicate the weights obtained from the spoke arrangement for γ = 0.2. For better visibility, the case of six clusters was omitted.

References

    1. Ahmed B, Anderson JC, Douglas RJ, Martin KA, Nelson JC. Polyneuronal innervation of spiny stellate neurons in cat visual cortex. J Comp Neurol. 1994;341:39–49. - PubMed
    1. Amir Y, Harel M, Malach R. Cortical hierarchy reflected in the organization of intrinsic connections in macaque monkey visual cortex. J Comp Neurol. 1993;334:19–46. - PubMed
    1. Anderson C, Douglas RJ, Martin KAC, Nelson JC. Synaptic output of physiologically identified spiny stellate neurons in cat visual cortex. J Comp Neurol. 1994;341:16–24. - PubMed
    1. Binzegger T, Douglas RJ, Martin KAC. A quantitative map of the circuit of cat primary visual cortex. J Neurosci. 2004;24:8441–8453. - PMC - PubMed
    1. Binzegger T, Douglas RJ, Martin KAC. Axons in cat visual cortex are topologically self-similar. Cereb Cortex. 2005;15:152–165. - PubMed

Publication types

LinkOut - more resources