Comparative Study
. 2007 Nov 7;27(45):12277-91.
doi: 10.1523/JNEUROSCI.1653-07.2007.

Single-unit firing in rat perirhinal cortex caused by fear conditioning to arbitrary and ecological stimuli

Affiliations
Comparative Study

Single-unit firing in rat perirhinal cortex caused by fear conditioning to arbitrary and ecological stimuli

Sharon C Furtak et al. J Neurosci. .

Abstract

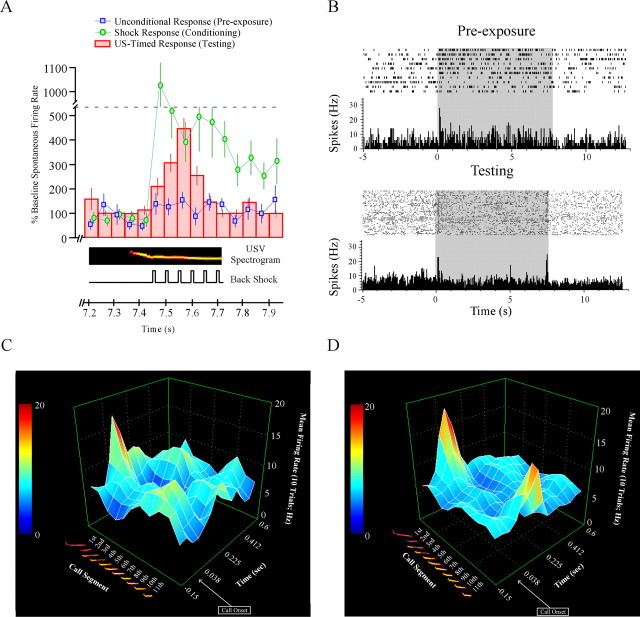
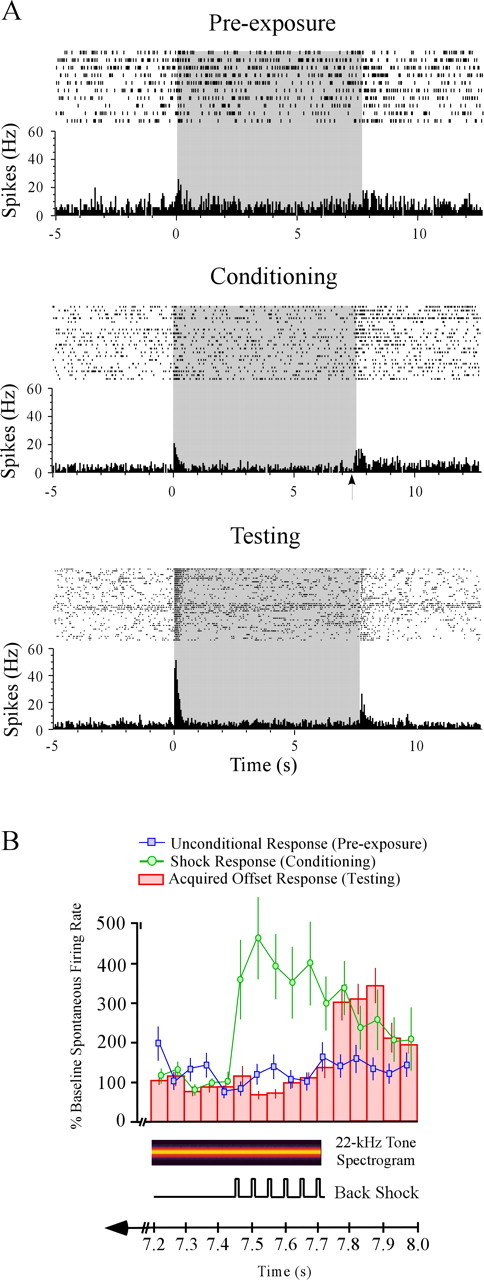
Pretraining lesions of rat perirhinal cortex (PR) severely impair pavlovian fear conditioning to a 22 kHz ultrasonic vocalization (USV) cue. However, PR lesions are without significant effect when the cue is a continuous tone at the same or a lower frequency. Here we examined fear-conditioning-produced changes in single-unit firing elicited in rat PR by a 22 kHz tone cue or a 22 kHz USV cue. Chronic recording electrodes were introduced from the lateral surface of the skull. Altogether, 200 well isolated units were studied in 28 rats. Overall, 73% of the recorded single units (145 of 200 units) evidenced statistically significant firing changes in response to the tone or USV conditional stimulus (CS) after it had been paired several times with an aversive unconditional stimulus (US). Interestingly, 33% of units (66 of 200 units) that were initially CS-unresponsive became CS-responsive after conditioning. After conditioning, there were two notable differences between single-unit responses elicited by the USV cue and those elicited by the tone cue. First, 11% of the units (14 of 123 units) recorded from the USV-conditioned group displayed a precisely timed increase in firing rate during the 260 ms interval in which the US had previously occurred. This US-timed response was unique to the USV-conditioned group. Second, the mean latency of cue-elicited firing was approximately 30 ms longer in the USV-conditioned group than in the tone-conditioned group. These cue-specific differences in acquired firing latencies and acquired firing patterns suggest that spectrotemporal properties of a CS can control the essential circuitry or neurophysiological mechanisms underlying fear conditioning.


Figures

Figure 1.
Figure 1.
Spectrograms of the two auditory stimuli that were used as cues for fear-conditioning. A, A 22 kHz tone lasting 7.712 s (65 db SPL). B, A 22 kHz USV lasting 7.712 s (65 db SPL). The bout of 11 calls is centered at ∼19 kHz (range, 19–22 kHz). The mean ± SE call duration was 575 ± 44.4 ms, and the mean intercall interval was 132 ± 1.5 ms.
Figure 2.
Figure 2.
A representative PR unit illustrated on two different timescales. A, Superimposed voltage waveforms from the preexposure, conditioning, and testing phases of the experiment. The indicated threshold voltage (arrow) triggered the capture of 1 ms time segments (300 μs before the threshold crossing and 700 μs after the threshold crossing) that were used off-line for single-unit analysis. Characteristically, an initial negative phase was followed by a positive phase. B, A portion of an oscilloscope trace showing spontaneous firing in the same unit during the intertrial interval of the conditioning stage of the experiment. This timescale shows that the positive phase of the voltage waveform was followed by a smaller and more prolonged negative phase (to the left of the asterisk).
Figure 3.
Figure 3.
Horizontal sections showing the location of recording sites within perirhinal cortex. A, Placements of 28 electrode bundles are mapped onto stereotaxic plates adapted from the atlas of Paxinos and Watson (1998). Results were combined from subjects conditioned to the USV (filled circles; n = 15 rats) and the tone (open circles; n = 13 rats) cues. Dorsoventral locations of plates 98–101 show the depth relative to bregma. CA1, Area CA1 of the hippocampal formation; CA3, area CA3 of the hippocampal formation; LEnt, lateral entorhinal cortex. B, A representative marking lesion, indicated by the arrow, made at the tip of an electrode bundle. The 70 μm horizontal section was stained for Nissl with cresyl violet.
Figure 4.
Figure 4.
Representative examples of seven different firing patterns elicited by the tone or the USV stimuli (see Fig. 1) during the preexposure period. Gray shading represents the presence of the auditory stimulus. Time bins in the frequency histogram are 50 ms wide. A, A phasic onset (+) response elicited by the USV. B, A phasic offset (+) response elicited by the tone. The hint of a tonic (−) response was not statistically significant. C, A tonic (+) response to the tone. D, A tonic (−) response to the tone. E, A phasic onset (+)/offset (+) response to the tone. F, A phasic onset (+)/tonic (+) response to the tone. G, A phasic onset (+)/tonic (−) response to the USV.
Figure 5.
Figure 5.
A call-related firing pattern elicited by a 22 kHz USV. Time bins are 50 ms. A, The raster plot and perievent histogram suggest a phasic onset (+)/tonic (+) response. The USV was present from 0 to 7.712 s (shaded area). The histogram hints at a degree of periodicity in the firing rate. The spectrogram of the USV is aligned and depicted underneath the time axis. B, The three-dimensional contour plot reveals that the apparent periodicity in the histogram is associated with firing to the onsets of individual calls of the USV. There is a large increase in the firing rate to the onset of the first call (indicated by the red elevation) and a progressively smaller increase in the firing rate to the onsets of subsequent calls.
Figure 6.
Figure 6.
Two types of firing patterns elicited by the somatosensory stimulus. Six 10 ms back shocks were presented in the interval between 0 and +0.26 s at 20 Hz (presence indicated by the gray shading). Time bins are 50 ms. A, A short-duration response, defined as a transient increase in firing rate (<250 ms). B, A long-duration response, defined as a more prolonged increase in firing rate (>250 ms). This particular long-duration response persisted for the entire 5 s period of postshock recording.
Figure 7.
Figure 7.
Acquired responsiveness to the two auditory stimuli. Time bins are 50 ms. Results from the preexposure stage (10 trails), the conditioning stage (20 trials), and the testing stage (40 trials) are plotted on the same axes. A, Single-unit responses to the USV during the three stages of the experiment. During the preexposure period, the unit exhibited no significant responses to the auditory stimulus. During the conditioning phase, the unit acquired a phasic onset (+) response. The arrow denotes the timing of the US, which also elicited firing. During testing, the unit exhibited both a phasic onset (+) response and a US-timed response. B, Single-unit responses to the tone during the three stages of the experiment. During the preexposure period, the unit was unresponsive to the tone. During conditioning, the unit acquired a phasic onset (+) response. The arrow denotes the time of the US, which also elicited firing. During the testing phase, the unit retained the phasic onset (+) response.
Figure 8.
Figure 8.
Acquisition of a US-timed firing pattern in response to the USV stimulus. The time bins are 50 ms. A, Combined data from 14 units that acquired a US-timed firing pattern. The level of firing (expressed as a percentage of the baseline rate) is plotted across the last 512 ms of the USV and for the next 238 ms after the stimulus offset. Blue-shaded squares and red-shaded bars, respectively, show firing during the preexposure and testing periods. Green-shaded circles show responses to the US during conditioning. Error bars are ±1 SE. B, A perievent histogram and raster plot of a single unit that acquired a US-timed response. During the preexposure period, this unit only exhibited a phasic onset (+) response to the first call. The shaded area denotes the presence of the USV. C, A three-dimensional contour plot showing firing in the same unit during the preexposure period. The firing rate only increased during the first call. D, A three-dimensional contour plot showing firing in the same unit during the testing phase. The unit retained the original response during the first call and acquired a US-timed response during the last call. The responses to the first and last calls give the contour a distinctive saddle shape, which was only seen in response to the USV after conditioning.
Figure 9.
Figure 9.
Acquired phasic onset (+) and phasic offset (+) responses to the 22 kHz tone. The time bins are 50 ms. A, Histograms and raster plots are shown for an example cell during the preexposure (top), conditioning (middle), and testing (bottom) phases of the experiment. The shaded area denotes the presence of the tone, and the arrow indicates the time of shock. Before conditioning, this unit did not exhibit any statistically significant responses to the tone. During conditioning, this unit did not exhibit any statistically significant responses to the tone. During conditioning, the unit has acquired a phasic onset (+) response. At this point, it is uncertain whether the response at the end of the cue is an acquired phasic offset (+) response or a response to the US. During testing, this unit demonstrated a phasic onset (+) response as well as a phasic offset (+) response. B, Combined data from the 23 cells that acquired a phasic offset (+) firing pattern. The level of firing (expressed as a percentage of the baseline rate) is plotted across the last 500 ms of the tone and the next 288 ms after the tone offset. Blue-shaded squares and red-shaded bars, respectively, show firing during the preexposure and testing periods. Green-shaded circles show responses to the US during conditioning. Error bars are ±1 SE.
Figure 10.
Figure 10.
Latencies of acquired phasic onset (+) firing patterns to the two auditory cues. Firing rates for each unit and each time bin were transformed to Z scores (from Eq. 1) and then averaged. The Z scores compared the firing rate in each 10 ms time bin with the firing rate during the 5 s baseline period just before the stimulus onset. Only the first 250 ms of the auditory stimulus presentation is shown. Open and filled bars, respectively, show the time course of firing rate during the preexposure and testing periods. A, The tone caused no statistically significant firing changes during the preexposure period. During the testing period, the earliest time bin to show a statistically significant increase in firing rate occurred in the interval from 20 to 30 ms. The maximum firing rate occurred in the interval from 30 to 40 ms. B, The USV caused no statistically significant firing changes during the preexposure period. During the testing period, the earliest time bin to show a statistically significant increase in firing rate occurred in the interval from 50 to 60 ms. The maximum firing rate occurred in the interval from 60 to 70 ms.
Figure 11.
Figure 11.
Similar levels of freezing elicited by the tone and USV cues during the testing phase of the experiment. Conditioning consisted of 20 CS–US pairings. During testing, freezing to the conditioning context was scored during a 2 min baseline period (labeled b) just before the first CS onset. Animals then received 40 CS-alone (extinction) trials during the next 16 min. Freezing was scored in 1 min time bins. The dashed line is the mean baseline freezing level of the combined groups. Error bars are ±1 SE. During first few CS-alone presentations, the peak freezing levels were so high that a ceiling effect could have obscured group differences.

Similar articles

Cited by

References

    1. Allen TA, Furtak SC, Brown TH. Single-unit responses to 22 kHz ultrasonic vocalizations in rat perirhinal cortex. Behav Brain Res. 2007a;182:327–336. - PMC - PubMed
    1. Allen TA, Narayanan NS, Kholodar-Smith DB, Zhao YJ, Laubach M, Brown TH. Imaging the spread of reversible inactivation using a fluorescent GABAA agonist. Soc Neurosci Abstr. 2007b;33:533–29. - PMC - PubMed
    1. Anderson JW. The production of ultrasonic sounds by laboratory rats and other mammals. Science. 1954;119:808–809. - PubMed
    1. Armony JL, Quirk GJ, LeDoux JE. Differential effects of amygdala lesions on early and late plastic components of auditory cortex spike trains during fear conditioning. J Neurosci. 1998;18:2592–2601. - PMC - PubMed
    1. Bang S, Allen TA, Jones LK, Boguszewski P, Brown TH. Asymmetrical generalization gradients toward social alarm calls in rats given differential fear conditioning. Soc Neurosci Abstr. 2006;32:67–15.

Publication types