

In vivo demonstration of neuroinflammatory molecule expression in brain abscess with diffusion tensor imaging
- PMID: 17989372
- PMCID: PMC8118972
- DOI: 10.3174/ajnr.A0826
In vivo demonstration of neuroinflammatory molecule expression in brain abscess with diffusion tensor imaging
Abstract
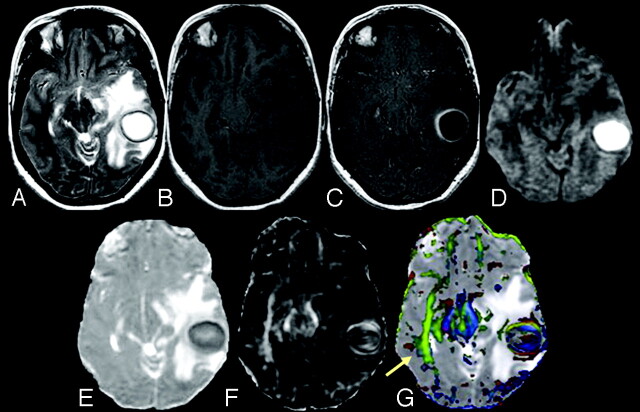
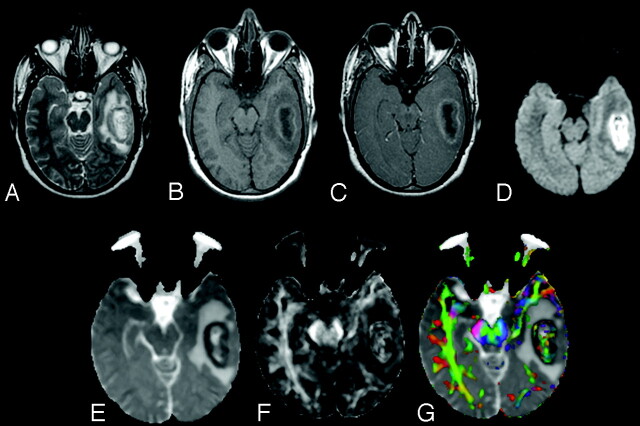
Background and purpose: Neuroinflammatory molecules, including tumor necrosis factor-alpha, interleukin1-beta, lymphocyte function associated molecule-1, and intercellular cell adhesion molecule-1 contribute to the development of brain abscess. We hypothesized that the high fractional anisotropy (FA) in the brain abscess cavity reflects the upregulation of these neuroinflammatory molecules.
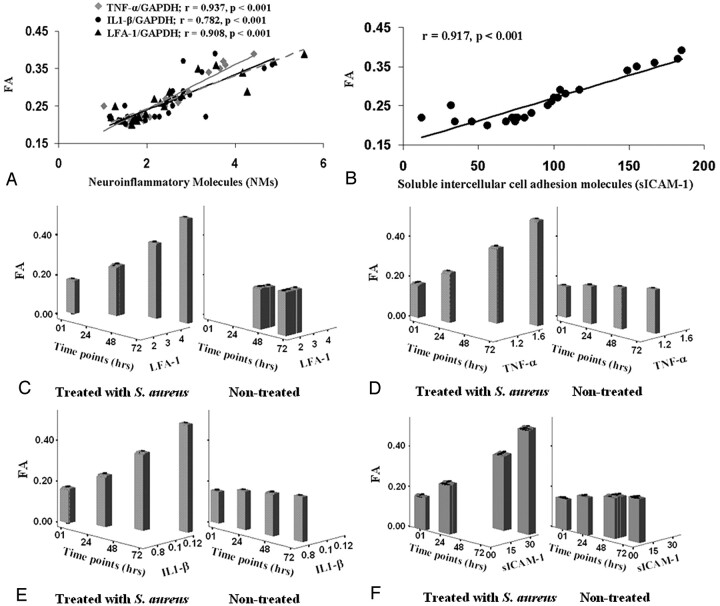
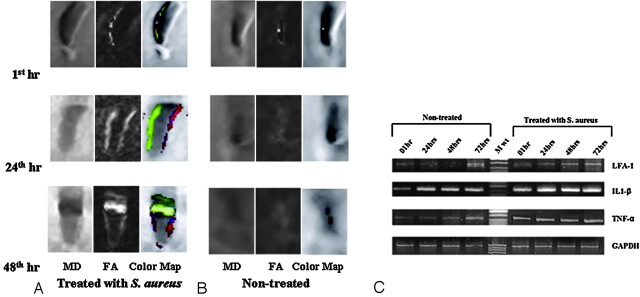
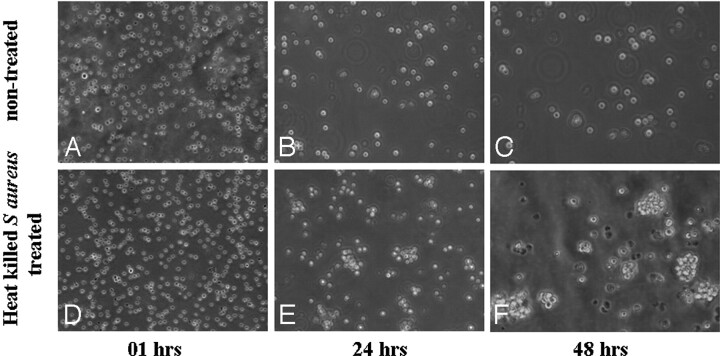
Materials and methods: Diffusion tensor imaging (DTI) was performed in 24 patients with brain abscess and Staphylococcus aureus-treated as well as nontreated Jurket cell lines (at 4 time points: 1, 24, 48, and 72 hours). Neuroinflammatory molecules were quantified from the brain abscess cavity aspirate of the patients as well as from the heat-killed S aureus-treated and nontreated cell lines and correlated with DTI measures.
Results: The DTI-derived FA strongly correlated with the presence of neuroinflammatory molecules in the pus as well as in S aureus-treated cell lines; no such correlation was observed in nontreated cell lines.
Conclusions: These data indicate that neuroinflammatory molecules confer high diffusion anisotropy inside the brain abscess cavity. We propose that increased FA reflects upregulated inflammatory response in brain abscess.
Figures
Comment in
-
A new era in neuroradiology: ex vivo validation of in vivo imaging research.AJNR Am J Neuroradiol. 2008 Feb;29(2):212-3. doi: 10.3174/ajnr.A0837. Epub 2007 Nov 7. AJNR Am J Neuroradiol. 2008. PMID: 17989368 Free PMC article. No abstract available.
Similar articles
-
Correlation of DTI metrics in the wall and cavity of brain abscess with histology and immunohistochemistry.NMR Biomed. 2010 Apr;23(3):262-9. doi: 10.1002/nbm.1448. NMR Biomed. 2010. PMID: 19839034
-
Can we differentiate true white matter fibers from pseudofibers inside a brain abscess cavity using geometrical diffusion tensor imaging metrics?NMR Biomed. 2008 Jul;21(6):581-8. doi: 10.1002/nbm.1228. NMR Biomed. 2008. PMID: 18050359
-
Differential diagnosis of intracranial ring enhancing cystic mass lesions--role of diffusion-weighted imaging (DWI) and diffusion-tensor imaging (DTI).Clin Neurol Neurosurg. 2010 Apr;112(3):218-25. doi: 10.1016/j.clineuro.2009.11.016. Epub 2010 Jan 6. Clin Neurol Neurosurg. 2010. PMID: 20053496
-
The role of diffusion tensor imaging and fractional anisotropy in the evaluation of patients with idiopathic normal pressure hydrocephalus: a literature review.Neurosurg Focus. 2016 Sep;41(3):E12. doi: 10.3171/2016.6.FOCUS16192. Neurosurg Focus. 2016. PMID: 27581308 Review.
-
The role of diffusion tensor imaging in the evaluation of ischemic brain injury - a review.NMR Biomed. 2002 Nov-Dec;15(7-8):561-9. doi: 10.1002/nbm.786. NMR Biomed. 2002. PMID: 12489102 Review.
Cited by
-
Correlation of quantitative diffusion tensor tractography with clinical grades of subacute sclerosing panencephalitis.AJNR Am J Neuroradiol. 2011 Apr;32(4):714-20. doi: 10.3174/ajnr.A2380. Epub 2011 Feb 17. AJNR Am J Neuroradiol. 2011. PMID: 21330388 Free PMC article. Clinical Trial.
-
Dynamic Imaging of Blood Coagulation Within the Hematoma of Patients With Acute Hemorrhagic Stroke.Stroke. 2024 Apr;55(4):1015-1024. doi: 10.1161/STROKEAHA.123.044343. Epub 2024 Jan 26. Stroke. 2024. PMID: 38275117 Free PMC article.
-
Imaging in sepsis-associated encephalopathy--insights and opportunities.Nat Rev Neurol. 2013 Oct;9(10):551-61. doi: 10.1038/nrneurol.2013.177. Epub 2013 Sep 3. Nat Rev Neurol. 2013. PMID: 23999468 Review.
-
Differentiation of brain abscesses from necrotic glioblastomas and cystic metastatic brain tumors with diffusion tensor imaging.AJNR Am J Neuroradiol. 2011 Oct;32(9):1646-51. doi: 10.3174/ajnr.A2581. Epub 2011 Aug 11. AJNR Am J Neuroradiol. 2011. PMID: 21835939 Free PMC article.
-
Differentiation of Neoplastic and Non-neoplastic Intracranial Enhancement Lesions Using Three-Dimensional Pseudo-Continuous Arterial Spin Labeling.Front Neurosci. 2022 Feb 24;16:812997. doi: 10.3389/fnins.2022.812997. eCollection 2022. Front Neurosci. 2022. PMID: 35299623 Free PMC article.
References
-
- Mathisen GE, Johnson JP. Brain abscess. Clin Infect Dis 1997;25:763–92 - PubMed
-
- Townsend GC, Scheld WM. Infections of the central nervous system. Adv Internal Med 1998;43:403–47 - PubMed
-
- Kielian T. Microglia and chemokines in infectious diseases of the nervous system: views and reviews. Front Biosci 2004;9:732–50 - PubMed
-
- Kielian T, Bearden ED, Baldwin AC. IL-1 and TNF-alpha play a pivotal role in the host immune response in a mouse model of Staphylococcus aureus-induced experimental brain abscess. J Neuropathol Exp Neurol 2004;63:381–96 - PubMed
Publication types
MeSH terms
Substances
LinkOut - more resources
Full Text Sources