

Comparing models for early warning systems of neglected tropical diseases
- PMID: 17989780
- PMCID: PMC2041810
- DOI: 10.1371/journal.pntd.0000033
Comparing models for early warning systems of neglected tropical diseases
Abstract
Background: Early warning systems (EWS) are management tools to predict the occurrence of epidemics of infectious diseases. While climate-based EWS have been developed for malaria, no standard protocol to evaluate and compare EWS has been proposed. Additionally, there are several neglected tropical diseases whose transmission is sensitive to environmental conditions, for which no EWS have been proposed, though they represent a large burden for the affected populations.
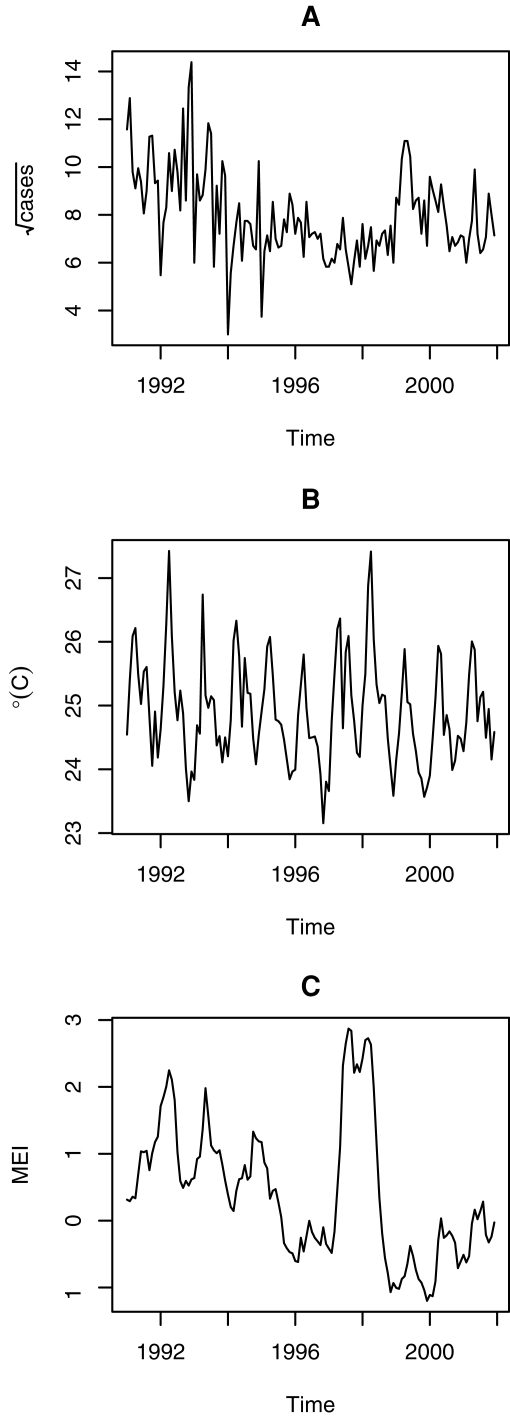
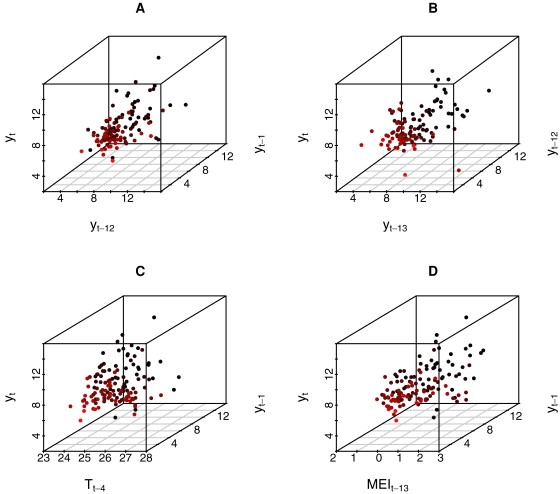
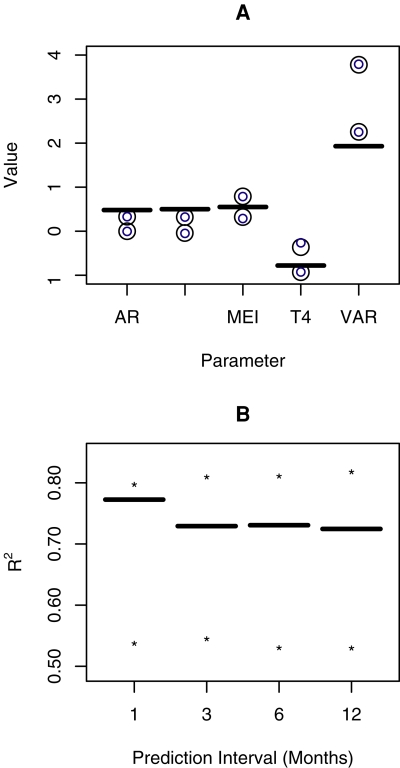
Methodology/principal findings: In the present paper, an overview of the available linear and non-linear tools to predict seasonal time series of diseases is presented. Also, a general methodology to compare and evaluate models for prediction is presented and illustrated using American cutaneous leishmaniasis, a neglected tropical disease, as an example. The comparison of the different models using the predictive R(2) for forecasts of "out-of-fit" data (data that has not been used to fit the models) shows that for the several linear and non-linear models tested, the best results were obtained for seasonal autoregressive (SAR) models that incorporate climatic covariates. An additional bootstrapping experiment shows that the relationship of the disease time series with the climatic covariates is strong and consistent for the SAR modeling approach. While the autoregressive part of the model is not significant, the exogenous forcing due to climate is always statistically significant. Prediction accuracy can vary from 50% to over 80% for disease burden at time scales of one year or shorter.
Conclusions/significance: this study illustrates a protocol for the development of EWS that includes three main steps: (i) the fitting of different models using several methodologies, (ii) the comparison of models based on the predictability of "out-of-fit" data, and (iii) the assessment of the robustness of the relationship between the disease and the variables in the model selected as best with an objective criterion.
Conflict of interest statement
The authors have declared that no competing interests exist.
Figures
Similar articles
-
Climate cycles and forecasts of cutaneous leishmaniasis, a nonstationary vector-borne disease.PLoS Med. 2006 Aug;3(8):e295. doi: 10.1371/journal.pmed.0030295. PLoS Med. 2006. PMID: 16903778 Free PMC article.
-
Climate and recruitment limitation of hosts: the dynamics of American cutaneous leishmaniasis seen through semi-mechanistic seasonal models.Ann Trop Med Parasitol. 2009 Apr;103(3):221-34. doi: 10.1179/136485909X398267. Ann Trop Med Parasitol. 2009. PMID: 19341537
-
Multiannual forecasting of seasonal influenza dynamics reveals climatic and evolutionary drivers.Proc Natl Acad Sci U S A. 2014 Jul 1;111(26):9538-42. doi: 10.1073/pnas.1321656111. Epub 2014 Jun 16. Proc Natl Acad Sci U S A. 2014. PMID: 24979763 Free PMC article.
-
The development of Malaria Early Warning Systems for Africa.Trends Parasitol. 2001 Sep;17(9):438-45. doi: 10.1016/s1471-4922(01)02077-3. Trends Parasitol. 2001. PMID: 11530356 Review.
-
Leishmaniasis emergence and climate change.Rev Sci Tech. 2008 Aug;27(2):399-412. Rev Sci Tech. 2008. PMID: 18819668 Review.
Cited by
-
Predictive models for the diagnostic of human visceral leishmaniasis in Brazil.PLoS Negl Trop Dis. 2012;6(2):e1542. doi: 10.1371/journal.pntd.0001542. Epub 2012 Feb 28. PLoS Negl Trop Dis. 2012. PMID: 22389742 Free PMC article.
-
Development and validation of climate and ecosystem-based early malaria epidemic prediction models in East Africa.Malar J. 2014 Aug 22;13:329. doi: 10.1186/1475-2875-13-329. Malar J. 2014. PMID: 25149479 Free PMC article.
-
Cutaneous leishmaniasis and sand fly fluctuations are associated with el niño in panamá.PLoS Negl Trop Dis. 2014 Oct 2;8(10):e3210. doi: 10.1371/journal.pntd.0003210. eCollection 2014 Oct. PLoS Negl Trop Dis. 2014. PMID: 25275503 Free PMC article.
-
Wetland characteristics linked to broad-scale patterns in Culiseta melanura abundance and eastern equine encephalitis virus infection.Parasit Vectors. 2017 Oct 18;10(1):501. doi: 10.1186/s13071-017-2482-0. Parasit Vectors. 2017. PMID: 29047412 Free PMC article.
-
The potential of resilience indicators to anticipate infectious disease outbreaks, a systematic review and guide.PLOS Glob Public Health. 2023 Oct 10;3(10):e0002253. doi: 10.1371/journal.pgph.0002253. eCollection 2023. PLOS Glob Public Health. 2023. PMID: 37815958 Free PMC article.
References
-
- Connor SJ, Thomson MC, Molyneux DH. Forecasting and prevention of epidemic malaria: new perspectives on an old problem. Parassitologia. 1999;41:439–448. - PubMed
-
- Thomson MC, Connor SJ. The development of malaria early warning systems for Africa. Trends Parasitol. 2001;17:438–445. - PubMed
-
- Tong SL, Hu WB, McMichael AJ. Climate variability and Ross River Virus transmission in Townsville region, Australia, 1985-1996. Trop Med Int Health. 2004;9:298–304. - PubMed
-
- Patz JA, Campbell-Lendrum D, Holloway T, Foley JA. Impact of regional climate change on human health. Nature. 2005;438:310–317. - PubMed
Publication types
MeSH terms
Grants and funding
LinkOut - more resources
Full Text Sources
Medical
Miscellaneous
