. 2007;45(12):1777-84.
doi: 10.1515/CCLM.2007.342.

Differential expression of gamma-aminobutyric acid receptor A (GABA(A)) and effects of homocysteine

Affiliations

Differential expression of gamma-aminobutyric acid receptor A (GABA(A)) and effects of homocysteine

Neetu Tyagi et al. Clin Chem Lab Med. 2007.

Abstract

Background: gamma-Aminobutyric acid (GABA) is a known inhibitory neurotransmitter in the mammalian central nervous system, and homocysteine (Hcy) behaves as an antagonist for GABA(A) receptor. Although the properties and functions of GABA(A) receptors are well studied in mouse neural tissue, its presence and significance in non-neural tissue remains obscure. The aim of the present study was to examine the expression of GABA(A) receptor and its subunits in non-neural tissue.

Methods: The mice were analyzed. The presence of GABA(A) receptor and its subunits was evaluated using Western blot and reverse transcription polymerase chain reaction.

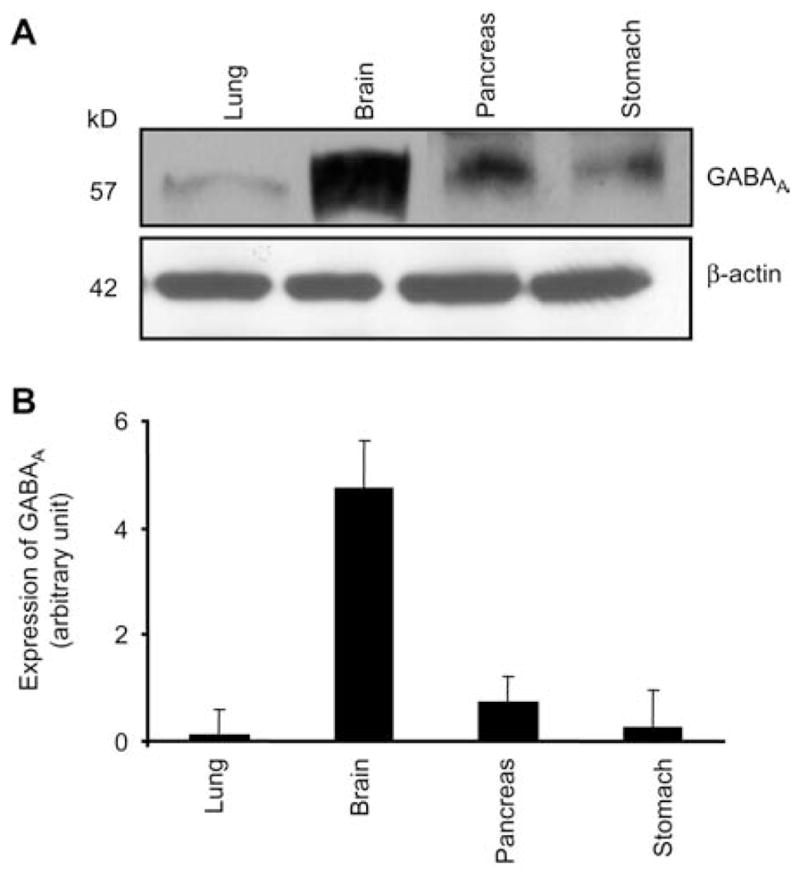
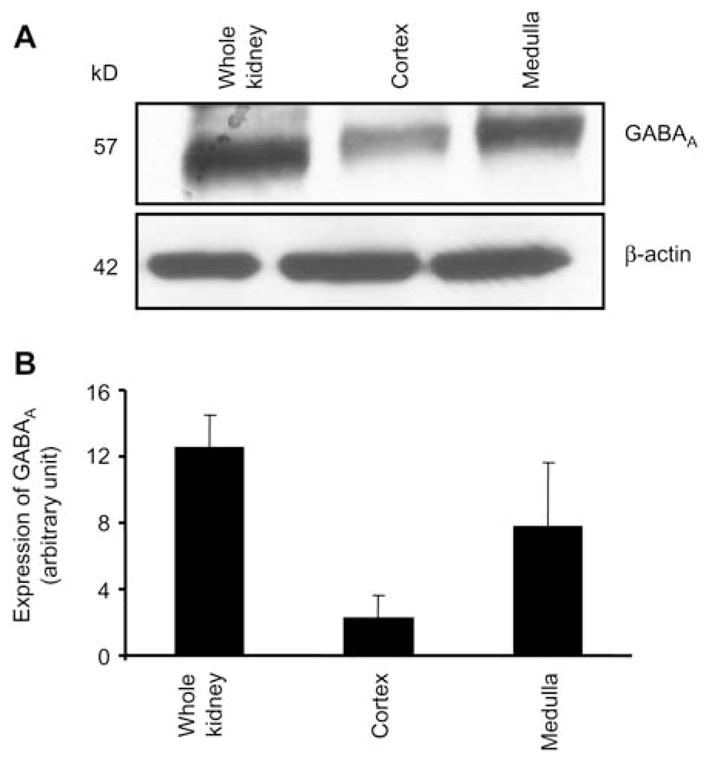
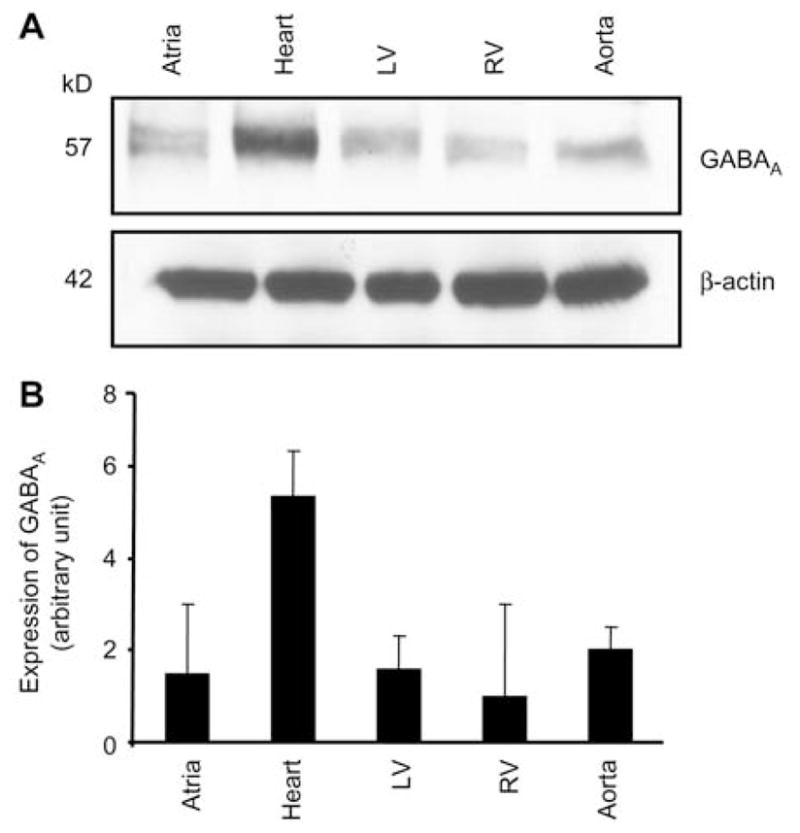
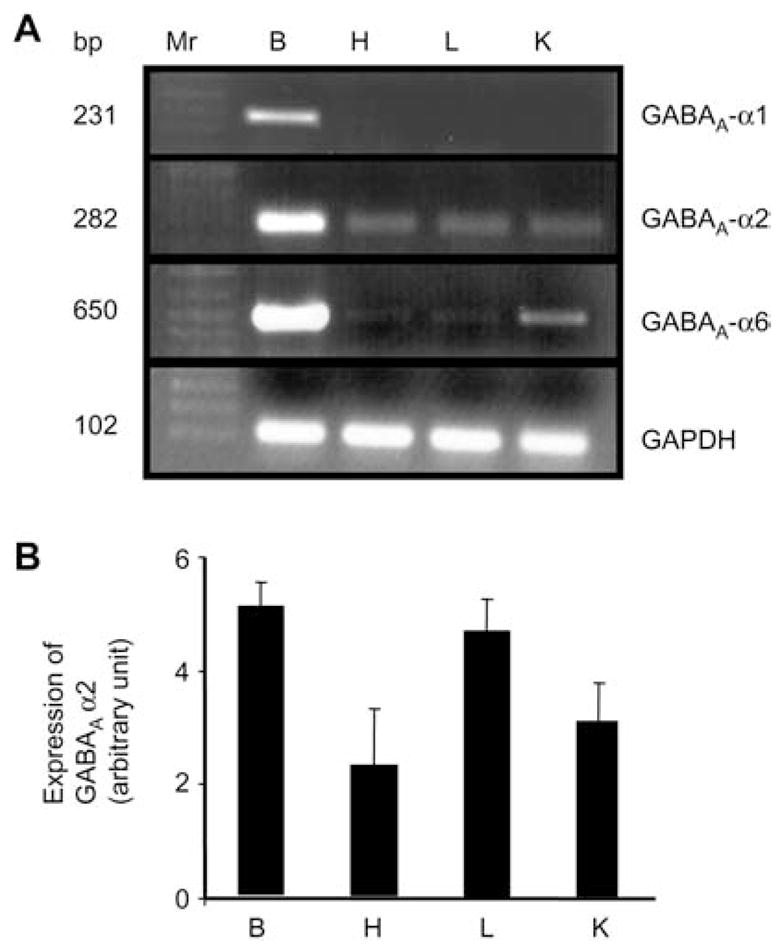
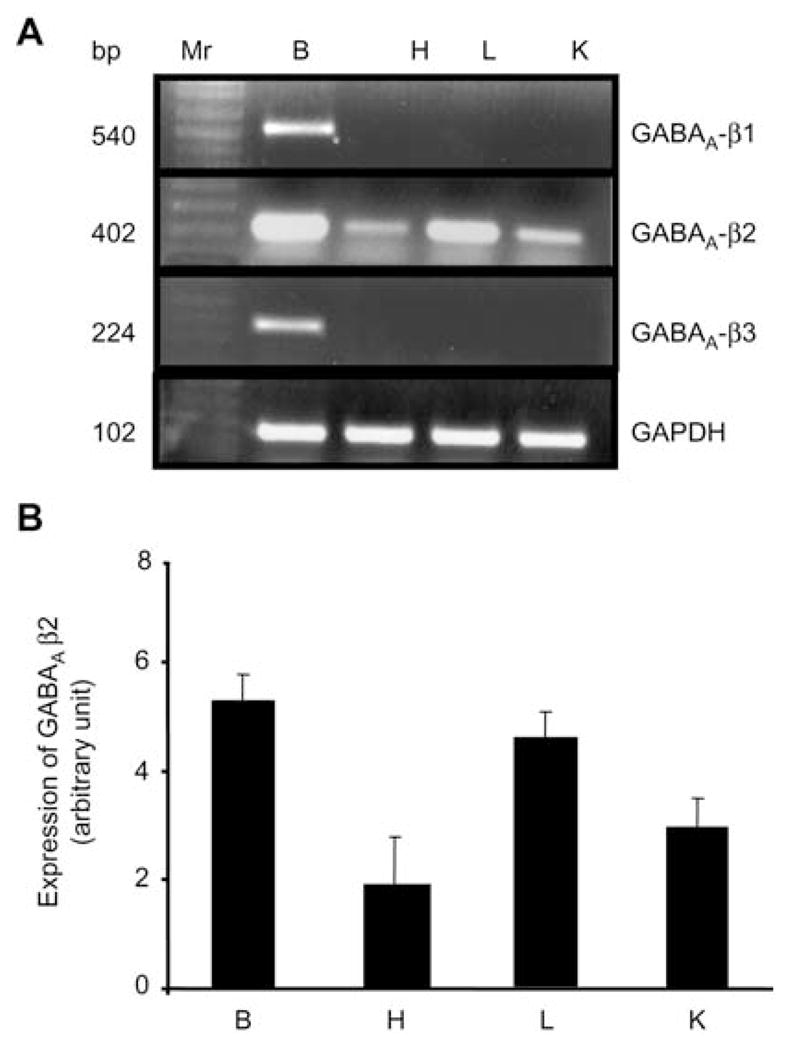
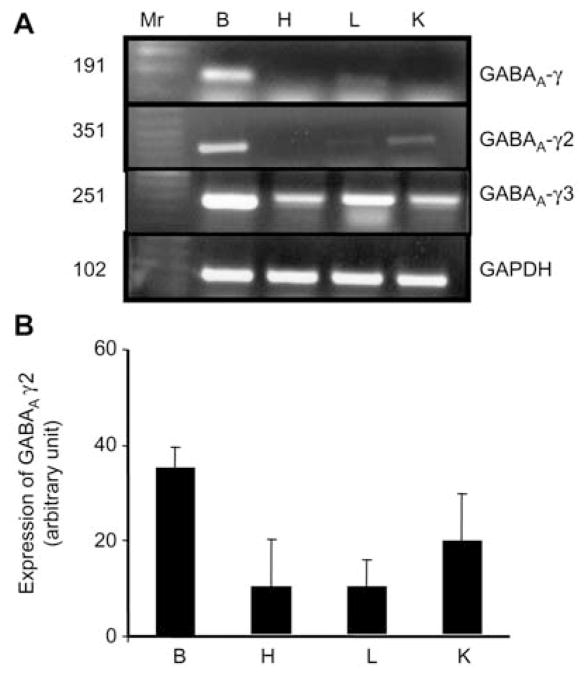
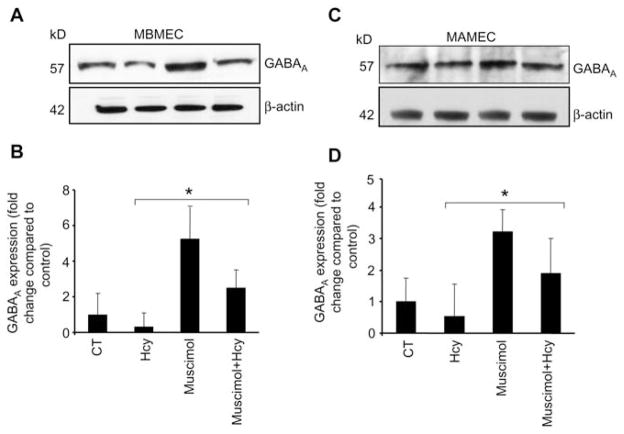
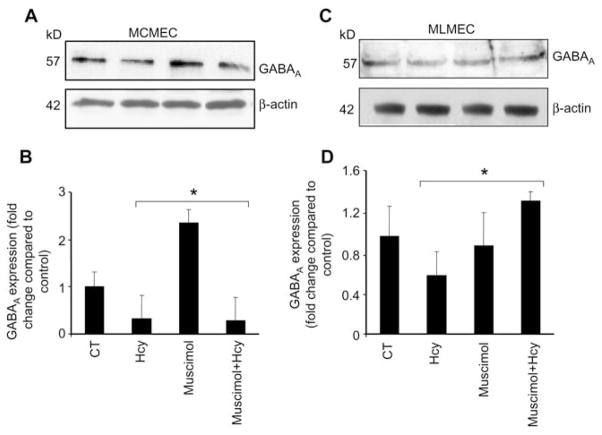
Results: We report that GABA(A) receptor protein is abundant in the renal medulla, cortex, heart, left ventricle, aorta and pancreas. Low levels of GABA(A) receptor protein were detected in the atria of the heart, right ventricle, lung and stomach. The mRNA protein expression of GABA(A) receptor subunit shows that alpha1, beta1, beta3 and gamma1 subunits are present only in brain. The mRNA protein expression levels of GABA(A) receptor alpha2, alpha6, beta2 and gamma3 subunits were highly expressed in brain compared to other tested tissue, while GABA(A) receptor gamma2 subunit was expressed only in brain and kidney. Treatment of microvascular endothelial cells with Hcy decreased GABA(A) receptor protein level, which was restored to its baseline level in the presence of GABA(A) receptor agonist, muscimol. The distribution of GABA(A) and GABA(B) receptors in wild type mice was determined and tissue-specific expression patterns were found showing that several receptor subtypes were also expressed in the central nervous system.

Conclusions: Hcy, a GABA(A) agonist, was found to decrease GABA(A) expression levels. These data enlarge knowledge on distribution of GABA receptors and give novel ideas of the effects of Hcy on different organs.


Figures

Figure 1
Figure 1
Expression of the GABAA receptor in brain (B), lung (L), pancreas (P) and stomach (S). Immunoblot analysis (A) and corresponding densitometry analyses (B). Values are mean±SEM, n=4 animals from each group. Corresponding β-actin bands are shown.
Figure 2
Figure 2
Expression of the GABAA receptor in renal system. Whole kidney, medulla and cortex. Western blot analysis of the GABAA receptor (top) and β-actin (bottom) in renal system (A) and corresponding densitometry analyses (B). Values are mean±SEM, n=4 animals from each group.
Figure 3
Figure 3
Expression of the GABAA receptor in mouse cardiovascular system. Heart, atrium, left ventricle (LV), right ventricle (RV) and aorta. Western blot analysis of the GABAA receptor (top) and β-actin (bottom) (A) and corresponding densitometry analyses (B). Values are mean±SEM, n=4 animals from each group.
Figure 4
Figure 4
The mRNA expression of GABAA receptor α sub-units in brain (B), heart (H), lung (L) and whole kidney (K). (A) Reverse transcription polymerase chain reaction (RT-PCR) analysis of GABAA-α subunits. Ethidium bromide-stained 1.0% agarose gels containing cDNA amplified from RT RNA using primers for GABAA subunits (α1–6). A 100-bp DNA ladder (MW) was included at the left of the gel (Lane 1). cDNA bands of the predicted size were obtained for all the above subunits. n=4 animals from each group. (B) Corresponding densitometry analyses (bottom). Values are mean±SEM, n=4 animals from each group.
Figure 5
Figure 5
The mRNA expression of GABAA-β subunits in brain (B), heart (H), lung (L) and whole kidney (K). (A) Reverse transcription polymerase chain reaction (RT-PCR) analysis of GABAA-β subunits. Ethidium bromide-stained 1.0% agarose gels containing cDNA amplified from RT RNA using primers for GABAA-β1–3. A 100-bp DNA ladder (MW) was included at the left of the gel (Lane 1). cDNA bands of the predicted size were obtained for all the above subunits. n=4 animals from each group. (B) Corresponding densitometry analyses (bottom). Values are mean±SEM, n=4 animals from each group.
Figure 6
Figure 6
The mRNA expression of GABAA-γ subunits in brain (B), heart (H), lung (L) and whole kidney (K). (A) Reverse transcription polymerase chain reaction (RT-PCR) analysis of GABAA-γ subunits. Ethidium bromide-stained 1.0% agarose gels containing cDNA amplified from RT RNA using primers for GABAA-γ1–3. A 100-bp DNA ladder (MW) was included at the left of the gel (Lane 1). cDNA bands of the predicted size were obtained for all the above subunits. n=4 animals from each group. (B) Corresponding densitometry analyses (bottom). Values are mean±SEM, n=4 animals from each group.
Figure 7
Figure 7
Western blot analysis showing muscimol-induced expression of GABAA receptor in cells. Cells (5–7 passages) were plated onto cell culture dishes, grown in complete media and allowed to become 80% confluent. Cells were serum deprived. (A) Mouse brain microvascular endothelial cells (MBMEC) and (C) mouse aorta microvascular endothelial cells (MAMEC) were cultured alone (CT), with 50 μM Hcy, 50 μM muscimol or 50 μM Hcy+50 μM muscimol. After 18 h, equal amounts of cellular protein were subjected to sodium dodecyl sulfate-polyacrylamide gel electrophoresis (SDS-PAGE) and blotted using GABAA receptor antibody. Corresponding β-actin bands are shown. Accompanying densitometry is shown in (B) and (D), respectively (n=4). *p−0.05 vs. control.
Figure 8
Figure 8
Western blot analysis showing muscimol-induced expression of GABAA receptor in cells. Cells (5–7 passages) were plated onto cell culture dishes, grown in complete media and allowed to become 80% confluent. Cells were serum deprived. (A) Mouse cardiac microvascular endothelial cells (MCMEC) and (C) mouse lung microvascular endothelial cells (MLMEC) were cultured alone (CT), with 50 μM Hcy, 50 μM muscimol or 50 μM Hcy+50 μM muscimol. After 18 h, equal amounts of cellular protein were subjected to sodium dodecyl sulfate-polyacrylamide gel electrophoresis (SDS-PAGE) and blotted using GABAA receptor antibody. Corresponding β-actin bands are shown. Accompanying densitometry is shown in (B) and (D), respectively (n=4). *p−0.05 vs. control.

Similar articles

Cited by

References

    1. Hunt MJ, Tyagi SC. Peroxisome proliferators compete and ameliorate Hcy-mediated endocardial endothelial cell activation. Am J Physiol Cell Physiol. 2002;283:C1073–9. - PubMed
    1. Bowery N. GABAB receptors and their significance in mammalian pharmacology. Trends Pharmacol Sci. 1989;10:401–7. - PubMed
    1. Martin IL, Dunn SM. GABA receptors. Tocris Review. Tocris Cookson Ltd; 2002. [Accessed 2002]. www.biotrend.com/download/gabarev.pdf.
    1. Awapara J, Landua AJ, Fuerst R, Seale B. Free gamma-aminobutyric acid in brain. J Biol Chem. 1950;87:35–9. - PubMed
    1. Roberts E, Frankel S. Gamma-aminobutyric acid in brain: its formation from glutamic acid. J Biol Chem. 1950;187:55–63. - PubMed

Publication types