. 2008 Jan 15;586(2):427-39.
doi: 10.1113/jphysiol.2007.145151. Epub 2007 Nov 8.

Lipopolysaccharide-induced down-regulation of Ca2+ release-activated Ca2+ currents (I CRAC) but not Ca2+-activated TRPM4-like currents (I CAN) in cultured mouse microglial cells

Affiliations

Lipopolysaccharide-induced down-regulation of Ca2+ release-activated Ca2+ currents (I CRAC) but not Ca2+-activated TRPM4-like currents (I CAN) in cultured mouse microglial cells

Andreas Beck et al. J Physiol. .

Abstract

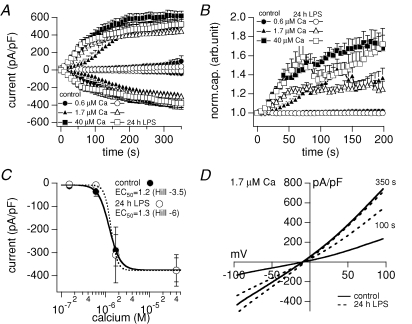
Microglia are the main immunocompetent cells of the mammalian central nervous system (CNS). Activation of cultured microglial cells and subsequent release of nitric oxide and cytokines critically depends on intracellular calcium levels. Since microglia undergo dramatic morphological, biochemical and electrophysiological changes in response to pathological events in the CNS, we investigated temporal changes in expression levels of ion channels involved in cellular calcium homeostasis in mouse cortical microglial cells in culture. Specifically, we assessed the inward and delayed outward rectifier potassium currents (I IRK and I DRK), calcium (Ca2+) release-activated Ca2+ currents (I CRAC) and Ca2+-activated TRPM4-like currents (I CAN) in non-activated microglia and cells that were activated by exposure to lipopolysaccharide (LPS) between 3 and 48 h. Unstimulated microglial cells, subcultured from an astrocyte coculture, typically exhibited a ramified, rod-shaped morphology. During the first 3 days of culture cell size and shape were maintained, but the percentage of cells showing prominent I IRK went up and those expressing I DRK went down. Cells retaining I DRK exhibited smaller amplitudes, whereas those of I IRK and I CRAC were not affected. However, after 24 h of exposure to 1 microg ml(-1) LPS, most cells showed an amoeboid ('fried egg'-shaped) morphology with a 62% increase in cell capacitance. At that point in time, only 14% of the cells revealed I IRK and 3% had I DRK exclusively, whereas the majority of cells expressed both currents. The amplitudes of I CRAC and I IRK progressively decreased after stimulation, whereas I DRK transiently reached a maximum after 6 h of LPS exposure and then returned to pre-stimulation expression levels. Cultured microglia also revealed TRPM4-like, Ca2+-activated non-selective currents (I CAN) with an EC50 of 1.2 microm [Ca2+]i. The expression levels of this current did not change significantly during and after 24 h of LPS exposure. We propose that LPS-induced down-regulation of I IRK and I CRAC will reduce the cell's capacity to produce significant calcium influx upon receptor activation and result in decreased sensitivity to exogenous stimulation. In this scenario, I CAN expression would remain constant, although its activity would automatically be reduced due to the diminished calcium influx capacity of the cell.


Figures

Figure 1
Figure 1. Morphology, cell size and [Ca2+]i
A, composite image of scanning electron micrographs of microglial cells at various stages of activation with 1 μg ml−1 LPS from non-activated (left cell, arborized) to fully activated (right cell, ‘fried egg’-shaped). B and C, percentage of ramified (^, ± s.e.m.) and ‘fried egg’-shaped (•, ± s.e.m.) cells per coverslip depending on time in subculture (B, day 1 n = 12, 2 n = 10, 3 n = 9, 4 n = 5, 5 n = 5, 6 n = 8, 7 n = 5 coverslips, 2142 cells) and incubation time in 1 μg ml−1 LPS (C, 0 h n = 32, 3 h n = 6, 6 h n = 8, 12 h n = 4, 24 h n = 9, 48 h n = 8 coverslips, 2211 cells). D and E, cell capacitance (in pF, ± s.e.m.) of microglial cells depending on time in subculture (D, day 1 n = 76, 2 n = 63, 3 n = 110, 4 n = 117, 5 n = 35, 6 n = 38, 7 n = 35 cells) and incubation time in 1 μg ml−1 LPS (E, 0 h n = 335, 3 h n = 40, 6 h n = 49, 12 h n = 29, 24 h n = 155, 48 h n = 43 cells). The controls (0 h LPS) in C and E represent the average data from day 3 to day 7 in B and D, respectively. F and G, intracellular Ca2+ changes (F340/F380) during the first 3 h (F, n = 22, 2 coverslips) and basic internal Ca2+ up to 48 h (G) after incubation with 1 μg ml−1 LPS. (G, 0 h n = 47, 3 h n = 57, 6 h n = 78, 12 h n = 54, 24 h n = 26, 48 h n = 45).
Figure 2
Figure 2. IIRK and IDRK
A and B, percentage of microglial cells in culture showing just IIRK (^, ± s.e.m.), just IDRK (▵, ± s.e.m.) or IIRK+DRK (•, ± s.e.m.) depending on time in subculture (A, day 1 n = 4, 2 n = 3, 3 n = 4, 4 n = 4, 5 n = 2, 6 n = 3, 7 n = 3 coverslips, 183 cells) and incubation time in 1 μg ml−1 LPS (B, 0 h n = 16, 3 h n = 4, 6 h n = 4, 12 h n = 2, 24 h n = 4, 48 h n = 3 coverslips, 247 cells). C, D and E, typical current–voltage relationships (IV) of whole-cell currents in microglial cells revealing just IIRK (C), just IDRK (D) and both, IIRK+DRK (E). F and G, average inward (IRK, •, ± s.e.m.) and outward (DRK, ^, ± s.e.m.) currents (in pA pF−1) measured at −110 and +80 mV, respectively, of microglial cells depending on time in subculture (F, day 1 n = 36, 2 n = 22, 3 n = 37, 4 n = 32, 5 n = 17, 6 n = 19, day 7 n = 18 cells) and (G) incubation time in 1 μg ml−1 LPS (circles, 0 h n = 123, 3 h n = 18, 6 h n = 27, 12 h n = 15, 24 h n = 28, 48 h n = 25 cells). The controls (0 h LPS) in B and G represent the average data from day 3 to day 7 in A and F, respectively.
Figure 3
Figure 3. ICRAC
A, average membrane current (ICRAC, in pA pF−1) measured at −110 mV 0–200 s after break-in from cultured microglial cells at day 1 (^, n = 14, ± s.e.m.), day 3 (•, n = 14, ± s.e.m.) and day 6 (▪, n = 14, ± s.e.m.) in subculture, and C, after 6 h (•, n = 8, ± s.e.m.), 12 h (^, n = 8, ± s.e.m.) and 48 h (□, n = 11, ± s.e.m.) incubation in 1 μg ml−1 LPS. B, average ICRAC amplitude (in −pA pF−1), measured at the plateau current (150 s to 200 s), in dependency of time in subculture (day 1 n = 13, 2 n = 11, 3 n = 14, 4 n = 12, 5 n = 12, 6 n = 15, 7 n = 7 cells). D, ICRAC (current in percentage of control ± s.e.m.) after 3 h (n = 8), 6 h (n = 7), 12 h (n = 7), 24 h (n = 9), and 48 h (n = 11) incubation with 1 μg ml−1 LPS. E, averaged current–voltage relationships (IVs) of whole-cell currents after 100 s into the experiment measured from a resting (control, n = 8), a 24 h (n = 8) and a 48 h (n = 10) activated microglial cell. The control (100%, 0 h LPS) in D represents the average data from day 3 to day 7 in B.
Figure 4
Figure 4. Calcium-activated (TRPM4-like) current
A, average inward and outward currents (in pA pF−1) measured for 350 s, and B, normalized cell capacitance measured for 200 s after break-in from resting (filled) and activated (24 h 1 μg ml−1 LPS, open) microglial cells with 0.6 μm (circles, n = 7/5, ± s.e.m.), 1.7 μm (triangles, n = 13/10, ± s.e.m.) and 40 μm (squares, n = 19/7, ± s.e.m.) free calcium ([Ca2+]i) in the patch pipette. C, plateau inward currents (in pA pF−1) after 350 s versus log [Ca2+]i of resting (•) and activated (24 h 1 μg ml−1 LPS, ^) microglial cells. The sigmoidal fits of the inward current amplitudes revealed an EC50 of 1.2 μm Ca2+ (Hill coefficient =−3.5) for resting and 1.3 μm Ca2+ (Hill =−6) for activated microglial cells. D, average current–voltage relationships (IVs) of whole-cell currents (in pA pF−1) activated by 1.7 μm internal Ca2+ from resting (control, continuous traces, n = 9) and activated (24 h 1 μg ml−1 LPS, dotted traces, n = 9) microglial cells at 100 s and 350 s into the experiment.

References

    1. abd-el-Basset E, Fedoroff S. Effect of bacterial wall lipopolysaccharide (LPS) on morphology, motility, and cytoskeletal organization of microglia in cultures. J Neurosci Res. 1995;41:222–237. - PubMed
    1. Ajmone-Cat MA, Nicolini A, Minghetti L. Prolonged exposure of microglia to lipopolysaccharide modifies the intracellular signaling pathways and selectively promotes prostaglandin E2 synthesis. J Neurochem. 2003;87:1193–1203. - PubMed
    1. Bader MF, Taupenot L, Ulrich G, Aunis D, Ciesielski-Treska J. Bacterial endotoxin induces [Ca2+]i transients and changes the organization of actin in microglia. Glia. 1994;11:336–344. - PubMed
    1. Baker CA, Manuelidis L. Unique inflammatory RNA profiles of microglia in Creutzfeldt-Jakob disease. Proc Natl Acad Sci U S A. 2003;100:675–679. - PMC - PubMed
    1. Biro T, Brodie C, Modarres S, Lewin NE, Acs P, Blumberg PM. Specific vanilloid responses in C6 rat glioma cells. Brain Res Mol Brain Res. 1998;56:89–98. - PubMed

Publication types

MeSH terms

LinkOut - more resources