

Regulation of elongation phase of mRNA translation in diabetic nephropathy: amelioration by rapamycin
- PMID: 17991718
- PMCID: PMC2111098
- DOI: 10.2353/ajpath.2007.070412
Regulation of elongation phase of mRNA translation in diabetic nephropathy: amelioration by rapamycin
Abstract
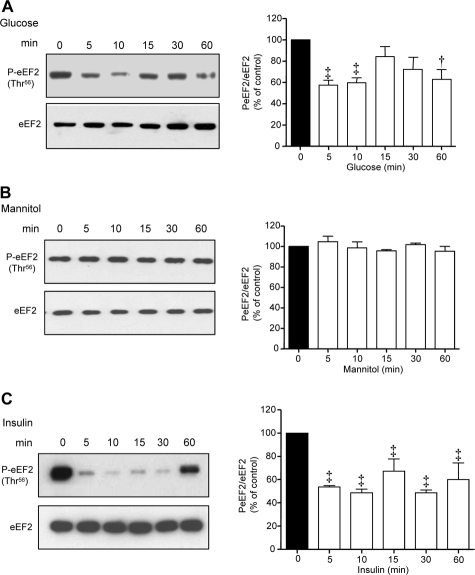
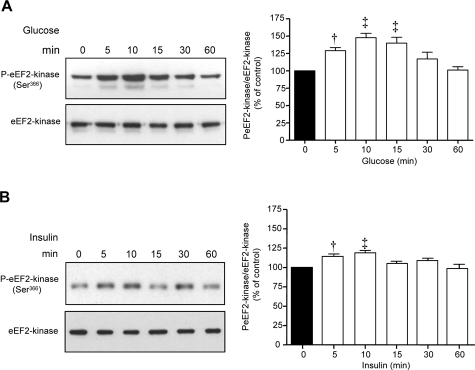
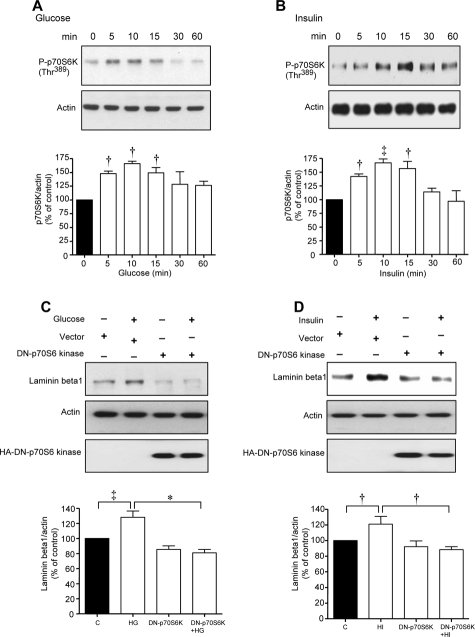
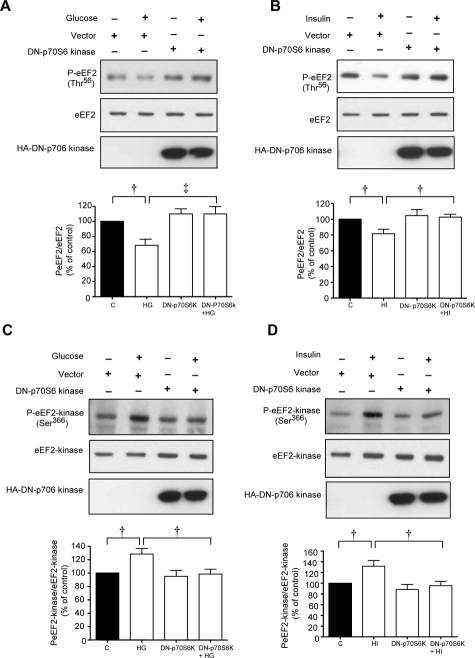
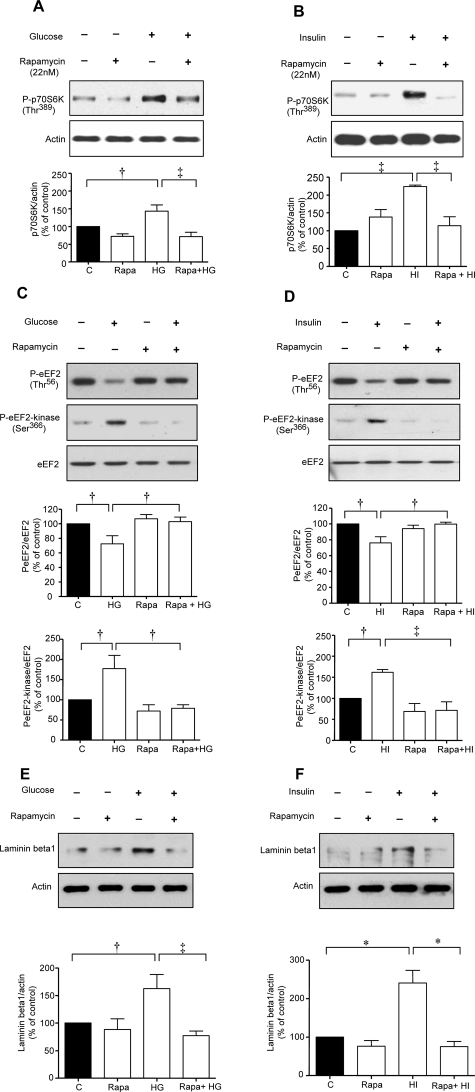
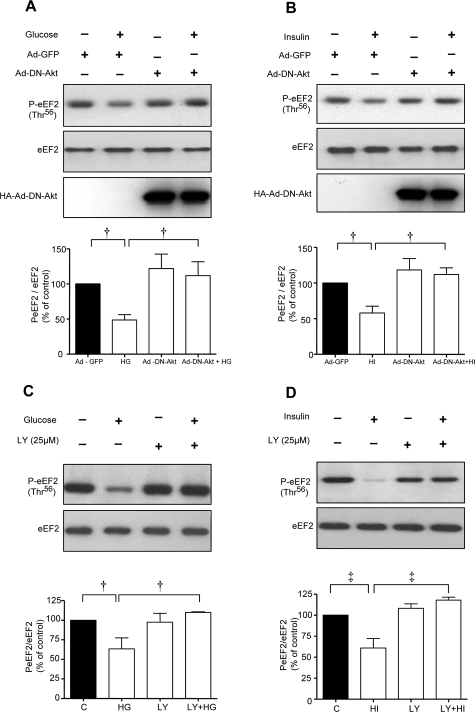
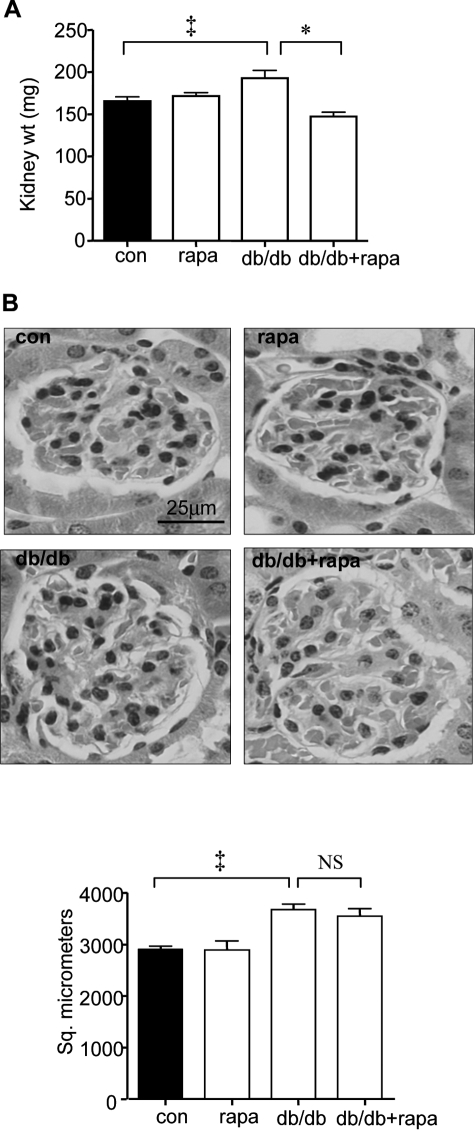
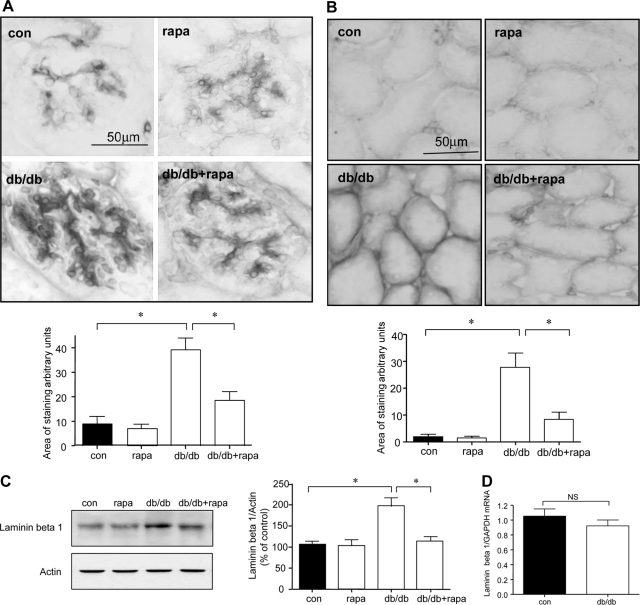
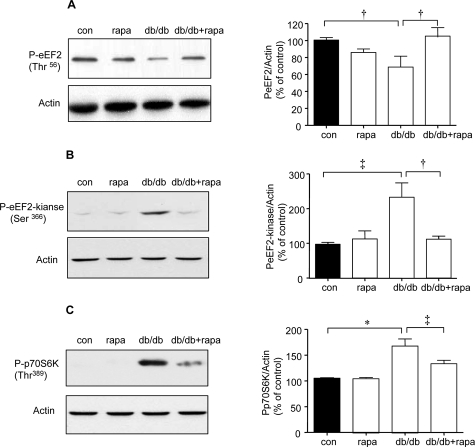
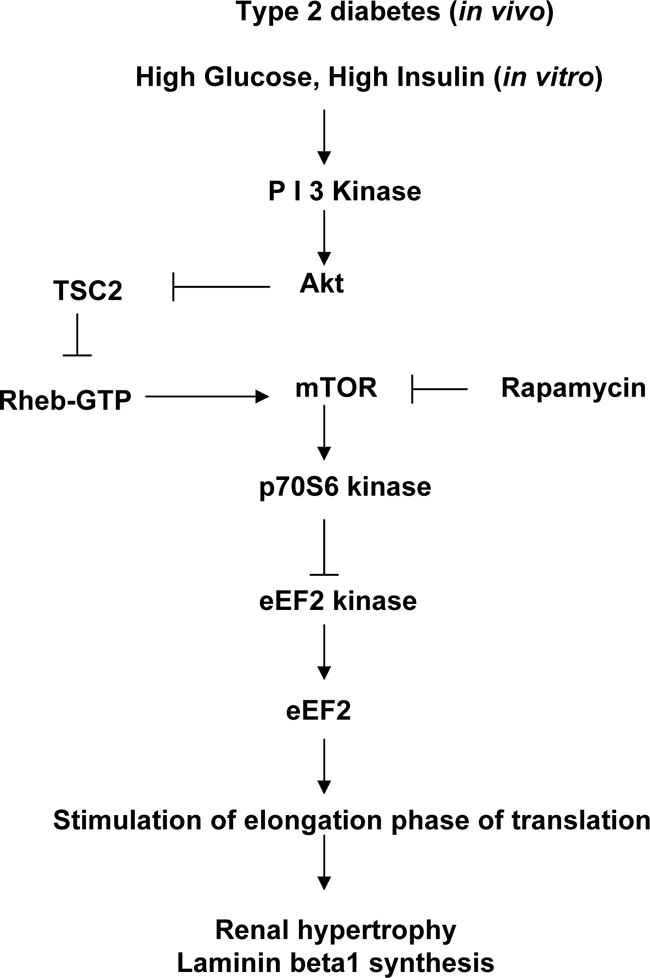
High glucose and high insulin, pathogenic factors in type 2 diabetes, induce rapid synthesis of the matrix protein laminin-beta1 in renal proximal tubular epithelial cells by stimulation of initiation phase of mRNA translation. We investigated if elongation phase of translation also contributes to high glucose and high insulin induction of laminin-beta1 synthesis in proximal tubular epithelial cells. High glucose or high insulin rapidly increased activating Thr56 dephosphorylation of eEF2 and inactivating Ser366 phosphorylation of eEF2 kinase, events that facilitate elongation. Studies with inhibitors showed that PI3 kinase-Akt-mTOR-p70S6 kinase pathway controlled changes in phosphorylation of eEF2 and eEF2 kinase induced by high glucose or high insulin. Renal cortical homogenates from db/db mice in early stage of type 2 diabetes showed decrease in eEF2 phosphorylation and increment in eEF2 kinase phosphorylation in association with renal hypertrophy and glomerular and tubular increase in laminin-beta1 content. Rapamycin, an inhibitor of mTOR, abolished diabetes-induced changes in phosphorylation of eEF2, eEF2 kinase, and p70S6 kinase and ameliorated renal hypertrophy and laminin-beta1 protein content, without affecting hyperglycemia. These data show that mTOR is an attractive target for amelioration of diabetes-induced renal injury.
Figures
Similar articles
-
Hydrogen sulfide inhibits high glucose-induced matrix protein synthesis by activating AMP-activated protein kinase in renal epithelial cells.J Biol Chem. 2012 Feb 10;287(7):4451-61. doi: 10.1074/jbc.M111.278325. Epub 2011 Dec 9. J Biol Chem. 2012. PMID: 22158625 Free PMC article.
-
Glycogen synthase kinase 3beta is a novel regulator of high glucose- and high insulin-induced extracellular matrix protein synthesis in renal proximal tubular epithelial cells.J Biol Chem. 2008 Nov 7;283(45):30566-75. doi: 10.1074/jbc.M801756200. Epub 2008 Aug 12. J Biol Chem. 2008. PMID: 18701453 Free PMC article.
-
Enhancement of translation elongation in neurons by brain-derived neurotrophic factor: implications for mammalian target of rapamycin signaling.J Neurochem. 2005 Dec;95(5):1438-45. doi: 10.1111/j.1471-4159.2005.03466.x. Epub 2005 Sep 20. J Neurochem. 2005. PMID: 16171514
-
Interplay between insulin and nutrients in the regulation of translation factors.Biochem Soc Trans. 2001 Aug;29(Pt 4):541-7. doi: 10.1042/bst0290541. Biochem Soc Trans. 2001. PMID: 11498025 Review.
-
Eukaryotic elongation factor-2 (eEF2): its regulation and peptide chain elongation.Cell Biochem Funct. 2011 Apr;29(3):227-34. doi: 10.1002/cbf.1740. Epub 2011 Mar 10. Cell Biochem Funct. 2011. PMID: 21394738 Review.
Cited by
-
Hydrogen sulfide inhibits high glucose-induced matrix protein synthesis by activating AMP-activated protein kinase in renal epithelial cells.J Biol Chem. 2012 Feb 10;287(7):4451-61. doi: 10.1074/jbc.M111.278325. Epub 2011 Dec 9. J Biol Chem. 2012. PMID: 22158625 Free PMC article.
-
Huang-Lian Jie-Du decoction: a review on phytochemical, pharmacological and pharmacokinetic investigations.Chin Med. 2019 Dec 18;14:57. doi: 10.1186/s13020-019-0277-2. eCollection 2019. Chin Med. 2019. PMID: 31867052 Free PMC article. Review.
-
Rapamycin passes the torch: a new generation of mTOR inhibitors.Nat Rev Drug Discov. 2011 Oct 31;10(11):868-80. doi: 10.1038/nrd3531. Nat Rev Drug Discov. 2011. PMID: 22037041 Review.
-
IGF-I increases the expression of fibronectin by Nox4-dependent Akt phosphorylation in renal tubular epithelial cells.Am J Physiol Cell Physiol. 2012 Jan 1;302(1):C122-30. doi: 10.1152/ajpcell.00141.2011. Epub 2011 Sep 21. Am J Physiol Cell Physiol. 2012. PMID: 21940672 Free PMC article.
-
Interventions against nutrient-sensing pathways represent an emerging new therapeutic approach for diabetic nephropathy.Clin Exp Nephrol. 2014 Apr;18(2):210-3. doi: 10.1007/s10157-013-0908-3. Epub 2013 Nov 14. Clin Exp Nephrol. 2014. PMID: 24221306 Review.
References
-
- Wolf G, Schanze A, Stahl RA, Shankland SJ, Amann K. p27(Kip1) knockout mice are protected from diabetic nephropathy: evidence for p27(Kip1) haplotype insufficiency. Kidney Int. 2005;68:1583–1589. - PubMed
-
- Kasinath BS, Mariappan MM, Sataranatarajan K, Lee MJ, Feliers D. mRNA translation: unexplored territory in renal science. J Am Soc Nephrol. 2006;17:3281–3292. - PubMed
-
- Proud CG. Signalling to translation: how signal transduction pathways control the protein synthetic machinery. Biochem J. 2007;403:217–234. - PubMed
-
- Ha TS, Barnes JL, Stewart JL, Ko CW, Miner JH, Abrahamson DR, Sanes JR, Kasinath BS. Regulation of renal laminin in mice with type II diabetes. J Am Soc Nephrol. 1999;10:1931–1939. - PubMed
-
- Mariappan MM, Feliers D, Mummidi S, Choudhury GG, Kasinath BS. High glucose, high insulin, and their combination rapidly induce laminin-beta1 synthesis by regulation of mRNA translation in renal epithelial cells. Diabetes. 2007;56:476–485. - PubMed
Publication types
MeSH terms
Substances
Grants and funding
LinkOut - more resources
Full Text Sources
Other Literature Sources
Medical
Molecular Biology Databases
Miscellaneous
