. 2008 Jan 25;283(4):2307-22.
doi: 10.1074/jbc.M708007200. Epub 2007 Nov 8.

Premelanosome amyloid-like fibrils are composed of only golgi-processed forms of Pmel17 that have been proteolytically processed in endosomes

Affiliations

Premelanosome amyloid-like fibrils are composed of only golgi-processed forms of Pmel17 that have been proteolytically processed in endosomes

Dawn C Harper et al. J Biol Chem. .

Abstract

Melanin pigments are synthesized within specialized organelles called melanosomes and polymerize on intraluminal fibrils that form within melanosome precursors. The fibrils consist of proteolytic fragments derived from Pmel17, a pigment cell-specific integral membrane protein. The intracellular pathways by which Pmel17 accesses melanosome precursors and the identity of the Pmel17 derivatives within fibrillar melanosomes have been a matter of debate. We show here that antibodies that detect Pmel17 within fibrillar melanosomes recognize only the luminal products of proprotein convertase cleavage and not the remaining products linked to the transmembrane domain. Moreover, antibodies to the N and C termini detect only Pmel17 isoforms present in early biosynthetic compartments, which constitute a large fraction of detectable steady state Pmel17 in cell lysates because of slow early biosynthetic transport and rapid consumption by fibril formation. Using an antibody to a luminal epitope that is destroyed upon modification by O-linked oligosaccharides, we show that all post-endoplasmic reticulum Pmel17 isoforms are modified by Golgi-associated oligosaccharide transferases, and that only processed forms contribute to melanosome biogenesis. These data indicate that Pmel17 follows a single biosynthetic route from the endoplasmic reticulum through the Golgi complex and endosomes to melanosomes, and that only fragments encompassing previously described functional luminal determinants are present within the fibrils. These data have important implications for the site and mechanism of fibril formation.


Figures
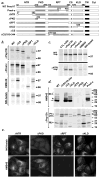
Figure 1
Figure 1. Assignment of monoclonal antibody epitopes to Pmel17 lumenal domain
a. Schematic diagram of wild-type (wt) Pmel17 primary structure, natural Pmel17 splice variant Pmel-s, and deletion mutants used in these experiments. Highlighted are lumenal sub-domains NTR (white), PKD (gray), RPT (hatched) and KLD (white) and the proprotein convertase cleavage site (CS; line). The transmembrane domain is indicated in black. Numbers for wtPmel17 correspond to amino acid positions within the long form in which each domain is defined; numbers within deletion mutants indicate amino acid positions defining the end of the deletion. For ΔCS and ΔCS/319-344, mutation of the dibasic cleavage site at KR468–469 to QQ is indicated by xx. b. HeLa cells transfected with WT Pmel17 or the indicated deletion mutants were metabolically labeled with 35S-methionine for 20 min at 37°C, and then cell lysates were subject to immunoprecipitation with the antibodies indicated to the left. Immunoprecipitates were analyzed by SDS-PAGE and phosphorimager analysis; positions of MW markers are indicated to the right. c. HeLa cells transfected with either WT Pmel17 or ΔNTR were labeled, subject to immunoprecipitation, and analyzed as in b. Arrows indicate positions of the relevant Pmel17 band. d. Whole cell lysates of HeLa cells transfected with the indicated WT Pmel17, Pmel-s, or the indicated deletion mutants were fractionated by SDS-PAGE and probed by immunoblotting with the indicated antibodies. Positions of MW markers are indicated at right, and of relevant bands at left. plc, post-lysis cleavage products; arrow, major HMB45 band observed for WT Pmel17; *, major HMB45 band observed for Pmel-s. e. HeLa cells transfected with the indicated constructs were analyzed by double label IFM using NKI-beteb and HMB45 mAbs and fluorochrome-conjugated secondary isotype-specific antibodies. Images for each antibody were taken at identical exposure times. Bar, 10 μm.
Figure 2
Figure 2. Immunoprecipitation of secreted Mα by NKI-beteb and HMB50 but not αPep13h or αPmel-I
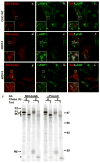
a–e. MNT-1 cells were metabolically labeled with 35S-methionine for 30 min and chased for the indicated time periods. Immunoprecipitates using the indicated antibodies from cell lysates or supernatants (supes) from each time point were fractionated by SDS-PAGE and analyzed by phosphorimager analysis. Positions of MW markers are indicated to the right, and relevant bands as discussed in the text are indicated to the left. Note that in this experiment some P1 band, presumably from cell fragments, were precipitated from supernatants by αPmel-I and less so by αPep13h. f. Supernatants from MNT-1 cells that had been metabolically labeled as in a–e and chased for 2 or 4 hrs were subjected to a primary immunoprecipitation (1° IP) with either HMB50, NKI-beteb or a control mAb (TA99 to Tyrp1) as indicated. Proteins were released from the beads as described in Materials and Methods, and then subjected to a secondary immunoprecipitation (2° IP Ab) using the indicated antibodies. Secondary immunoprecipitates were fractionated by SDS-PAGE and analyzed by phosphorimaging analysis. All gels were exposed for identical periods of time. Positions of MW markers are indicated to the right.
Figure 3
Figure 3. Anti-Pmel mAbs, but not anti-peptide Abs, detect stage II melanosomes in MNT-1 cells
MNT-1 cells were analyzed by two-color IFM as described in Materials and Methods. Aa-i. Cells were analyzed with pairwise combinations of each of the anti-Pmel mAbs, HMB45, HMB50 and NKI-beteb using Alexa488- and Alexa594-conjugated isotype-specific secondary antibodies. c, f and i, merged images. Insets show 4X magnified images of the boxed regions, and arrows point to examples of puncta labeled by both antibodies in each panel; note that a “yellow” color in the merge is observed only when labeling by both antibodies is equivalent. Cells in panels a–f and g–i respectively were fixed with 2% and 6% formaldehyde; similar patterns were observed under both conditions. Bar, 10 μm. Ba-i. Cells were analyzed with pairwise combinations of NKI-beteb with either αPep13h (df), αPmel-I (g-i) or αPmel-N (jl) and Alexa488-conjugated anti-rabbit Ig and Alexa594-conjugated anti-mouse Ig. Shown are the pseudocolored individual images for each rabbit antibody (d, g and j) and NKI-beteb (e, h and k) and merged images (f, i, l). Insets show 3X-magnified images of the boxed regions. Cells were all fixed with 6% formaldehyde. Bar, 10 μm.
Figure 4
Figure 4. αPmel-I labels ER and ERGIC compartments
MNT-1 cells were fixed with 6% formaldehyde and analyzed by two-color IFM with αPmel-I (a, d) and mAbs to the ER marker calnexin (b) or the ERGIC marker ERGIC-53 (e). Merged images are shown in panels c and f, and insets show 4X-magnified images of the boxed regions. Arrows denote regions of overlap for the two sets of markers. Bar, 10 μm.
Figure 5
Figure 5. Labeling of ER and ERGIC by αPmel-I by immunoelectron microscopy
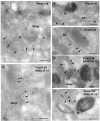
Ultrathin cryosections of MNT-1 cells were analyzed by immunogold labeling using αPmel-I and protein A conjugated to 10 nm gold particles alone (ac) or with antibodies to the ERGIC markers ERGIC-53 (d, e) or KDEL receptor (KDEL-R; panel f) and protein A conjugated to15 nm gold particles as indicated. Arrows point to 10 nm gold particles labeling αPmel-I-reactive structures, and arrowheads point to 15 nm gold particles labeling ERGIC-53 (d, e) or KDEL-R (f). ER, Golgi, ERGIC, a mitochondrion (m) and stage IV melanosomes (IV) are indicated. Bars, 200 nm.
Figure 6
Figure 6. Pmel isoforms detected by αPmel-I do not access the cell surface
a, b. MNT-1 cells in suspension were labeled on ice with the indicated antibodies and PE-conjugated anti-rabbit Ig and analyzed by flow cytometry as described in Materials and Methods. In a, fluorescence intensity signal relative to cell number is shown for a representative experiment, and in b the median fluorescence intensity for samples from two experiments performed in duplicate are indicated graphically along with standard deviation. c, d. MNT-1 cells in suspension were incubated for 30 min at 37°C with the indicated antibodies, then fixed, permeabilized, and labeled with PE-conjugated anti-rabbit Ig and Alexa488-conjugated anti-mouse Ig prior to analysis by flow cytometry. c, results from a representative experiment. d, median fluorescence intensity for samples from two experiments performed in duplicate is indicated graphically along with standard deviation. The control mAb (Ctl. mAb) was XD5.A11, which recognizes human leukocyte antigen class II β chains. e., MNT-1 cells in suspension were fixed and permeabilized prior to labeling with αPmel-I or a control rabbit antibody (Ctl. Ab; anti-Tac). Representative of three experiments performed in duplicate.
Figure 7
Figure 7. O-glycosylation of Pmel17 and inverse recognition of O-glycoforms byαPmel-I and HMB45
a. MNT-1 cells were metabolically labeled with 35S-methionine/cysteine for 30 min and then chased for 2 h. Cell lysates were immunoprecipitated with αPep13h, and immunoprecipitates were either mock treated (-) or treated with endoH (H), PNGase F (F), PNGase F and neuraminidase (FN), or PNGase F, neuraminidase and a mixture of O-glycanases (FON). Positions of MW markers and relevant initial bands are indicated to the left, and positions of cleavage products are indicated to the right. Note that P1 migrates similarly after cleavage by either endoH (P1’H) or PNGase F. b, c. MNT-1 whole cell lysates were mock treated (-) or treated with glycosidases as in a, and then fractionated by SDS-PAGE, transferred to PVDF membranes (using 15% methanol to favor transfer of lower Mr material) and immunoblotted with either HMB45 or αPmel-I as indicated. Positions of MW markers are indicated to the right. Note the neuraminidase-dependent disappearance of HMB45-reactive bands and the O-glycanase-dependent appearance of a smaller αPmel-I-reactive band.
Figure 8
Figure 8. Pmel17 in CHO cells lacking O-linked oligosaccharides react withαPmel-I but not HMB45
ad. Wild-type CHO-K1 cells (CHO WT; a, b) or ldlD14 cells (c, d) were transfected with full-length Pmel expression vector and analyzed by IFM with HMB45 (a, c) or αPmel-I (b, d). Each pair of panels is from the same field, and images of labeling with each antibody are taken at identical exposures in both cell lines. Note the absence of HMB45 reactivity and the appearance of extensive labeling of the cell surface and intracellular puncta with αPmel-I in ldlD14 cells. By contrast, αPmel-I labels a reticular network (indicative of the ER) in cells expressing high levels of Pmel but very little, other than background nuclear labeling, in cells expressing low levels of Pmel. e. Whole cell lysates of untreated MNT-1 cells or of ldlD14 or wild-type CHO-K1 cells (CHO WT) that had been transfected with Pmel expression vector were fractionated by SDS-PAGE and analyzed by immunoblotting with the indicated antibodies. Positions of MW markers are indicated to the right. f. Wild-type CHO-K1 cells (CHO WT) or ldlD14 cells (CHO ldlD14) were metabolically labeled with 35S-methionine/cysteine for 30 min and chased for 0 or 2 h, as indicated. Pmel was immunoprecipitated from cell lysates with αPep13h, and immunoprecipitates were mock treated (-) or treated with endoH (H) or PNGase F (F) before fractionation by SDS-PAGE and phosphorimager analysis. Arrows to the left indicate positions of wild-type bands and positions of MW markers are indicated to the right.
Figure 9
Figure 9. Pmel trafficking to multivesicular endosomes requires neither O-linked nor N-linked oligosaccharides
ai. Wild-type CHO-K1 cells (CHO WT; a–c) or ldlD14 cells (d–i) were transfected with full-length Pmel expression vector and analyzed by IFM using NKI-beteb and rabbit anti-LAMP-1 as primary antibodies, Alexa488-anti-mouse Ig and Alexa594-anti-rabbit Ig as secondary antibodies. Shown are individual images for NKI-beteb (a, d, g) and LAMP-1 (b, e, h) and merged images (c, f, i), and insets show 4X magnifications of the boxed regions. The starred cell (*) in gi is representative of cells overexpressing Pmel in which LAMP-1 labeling is diminished. Arrows provide orientation among the different labeled insets. Note that Pmel labeling always abuts structures labeled by LAMP-1. . j. MNT-1 melanoma cells were metabolically labeled for 30 min with 35S-methionine/cysteine and chased for 0 or 2 h in the absence (-) or presence of 2.4 μM tunicamycin (T) as described in Materials and Methods. Cell lysates were immunoprecipitated with NKI-beteb or αPmel-N, and immunoprecipitates were fractionated by SDS-PAGE and analyzed by phosphorimaging. Indicated at left are positions of wild-type P1, P2, Mα and Mβ bands (arrows) and bands altered by tunicamycin treatment (*). Positions of MW markers are indicated to the right.
Figure 10
Figure 10. Schematic diagram of Pmel isoforms in different compartments and their antibody reactivity
a. Schematic diagram of the Pmel primary structure with domains indicated as in Fig. 1. Sites for addition of N-linked glycosylation sites, known O-linked glycosylation sites, and putative additional O-glycosylation sites (gray) are indicated; note that one N-linked glycan is never modified to the complex form (5,24). Also indicated are binding sites for the six antibodies used in this study. Numbers at top indicate the positions of the amino acid boundaries for recognition by HMB50, NKI-beteb, and HMB45 and for the two known O-glycosylation sites (this study and ref. 25). Note that binding of HMB45 to the region bounded by residues 328 and 344 for HMB45 requires the sialylated O-linked oligosaccharide, whereas binding of αPmel-I to the same region is inhibited by O-glycosylation of the site. b. Schematic diagram of the different processed forms of Pmel, indicating the intracellular compartment in which each form is primarily localized and whether or not the isoform reacts (Ab reactivity) with the antibodies αPmel-N (αN), αPmel-I (αI), HMB45 and αPep13h (α13h). Modifications from one form to the next are highlighted in black, and core N- and O-linked glycans and glycan modifications (including sialic acid) are indicated as described in the figure. ER, endoplasmic reticulum; St II, stage II melanosomes. Scissors indicate cleavage events. The mature fibrils may contain either individual PKD and RPT domain fragments, tandem fragments, or both. A bar indicates disulfide bond linkage between the Mα and Mβ fragments; the precise cysteine residues that contribute to this bond/these bonds are not yet known.

Similar articles

Cited by

References

    1. Marks MS, Seabra MC. Nature Rev Mol Cell Biol. 2001;2(10):738–748. - PubMed
    1. Hearing VJ. Pigment Cell Res. 2000;13(Suppl 8):23–34. - PubMed
    1. Theos AC, Truschel ST, Raposo G, Marks MS. Pigment Cell Res. 2005;18(5):322–336. - PMC - PubMed
    1. Fowler DM, Koulov AV, Alory-Jost C, Marks MS, Balch WE, Kelly JW. PLoS Biol. 2006;4(1):e6. - PMC - PubMed
    1. Berson JF, Harper D, Tenza D, Raposo G, Marks MS. Mol Biol Cell. 2001;12(11):3451–3464. - PMC - PubMed

Publication types

MeSH terms

LinkOut - more resources