

A specific role of AGS3 in the surface expression of plasma membrane proteins
- PMID: 17991770
- PMCID: PMC2084303
- DOI: 10.1073/pnas.0709282104
A specific role of AGS3 in the surface expression of plasma membrane proteins
Abstract
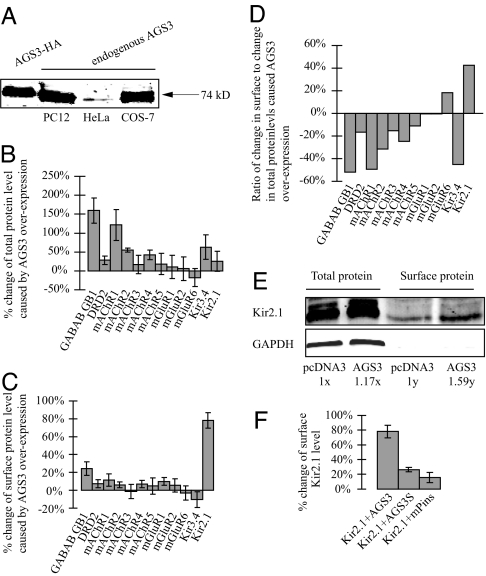
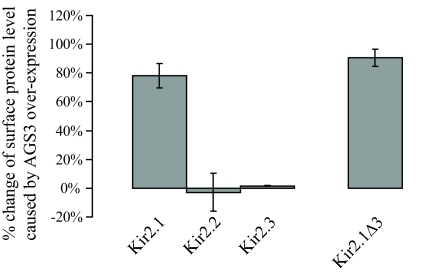
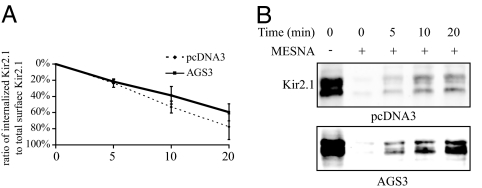
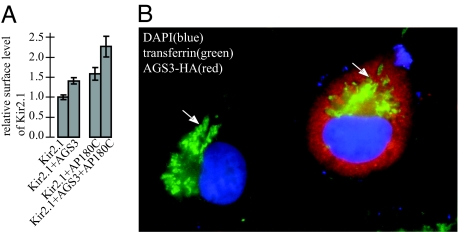
Activator of G protein signaling 3 (AGS3), originally identified in a functional screen for mammalian proteins that activate heterotrimeric G protein signaling, is known to be involved in drug-seeking behavior and is up-regulated during cocaine withdrawal in animal models. These observations indicate a potential role for AGS3 in the formation or maintenance of neural plasticity. We have found that the overexpression of AGS3 alters the surface-to-total ratios of a subset of heterologously expressed plasma membrane receptors and channels. Further analysis of the endocytic trafficking of one such protein by a biotin-based internalization assay suggests that overexpression of AGS3 moderately affects the internalization or recycling of surface proteins. Moreover, AGS3 overexpression and siRNA-mediated knockdown of AGS3 both result in the dispersal of two endogenously expressed trans-Golgi network (TGN)-associated cargo proteins without influencing those in the cis- or medial-Golgi compartments. Finally, adding a TGN-localization signal to a CD4-derived reporter renders the trafficking of fusion protein sensitive to AGS3. Taken together, our data support a model wherein AGS3 modulates the protein trafficking along the TGN/plasma membrane/endosome loop.
Conflict of interest statement
The authors declare no conflict of interest.
Figures
Similar articles
-
Translocation of activator of G-protein signaling 3 to the Golgi apparatus in response to receptor activation and its effect on the trans-Golgi network.J Biol Chem. 2013 Aug 16;288(33):24091-103. doi: 10.1074/jbc.M112.444505. Epub 2013 Jun 14. J Biol Chem. 2013. PMID: 23770668 Free PMC article.
-
The PDZ and band 4.1 containing protein Frmpd1 regulates the subcellular location of activator of G-protein signaling 3 and its interaction with G-proteins.J Biol Chem. 2008 Sep 5;283(36):24718-28. doi: 10.1074/jbc.M803497200. Epub 2008 Jun 19. J Biol Chem. 2008. PMID: 18566450 Free PMC article.
-
Identification of a deubiquitinating enzyme as a novel AGS3-interacting protein.PLoS One. 2010 Mar 17;5(3):e9725. doi: 10.1371/journal.pone.0009725. PLoS One. 2010. PMID: 20305814 Free PMC article.
-
Endosome-to-Golgi transport pathways in physiological processes.Histol Histopathol. 2011 Mar;26(3):395-408. doi: 10.14670/HH-26.395. Histol Histopathol. 2011. PMID: 21210352 Review.
-
Activators of G-protein signaling 3: a drug addiction molecular gateway.Behav Pharmacol. 2010 Sep;21(5-6):500-13. doi: 10.1097/FBP.0b013e32833dcfa5. Behav Pharmacol. 2010. PMID: 20700046 Free PMC article. Review.
Cited by
-
G protein-coupled receptors and resistance to inhibitors of cholinesterase-8A (Ric-8A) both regulate the regulator of g protein signaling 14 RGS14·Gαi1 complex in live cells.J Biol Chem. 2011 Nov 4;286(44):38659-38669. doi: 10.1074/jbc.M111.274928. Epub 2011 Aug 31. J Biol Chem. 2011. PMID: 21880739 Free PMC article.
-
AGS3-based optogenetic GDI induces GPCR-independent Gβγ signalling and macrophage migration.Open Biol. 2025 Feb;15(2):240181. doi: 10.1098/rsob.240181. Epub 2025 Feb 5. Open Biol. 2025. PMID: 39904370 Free PMC article.
-
Intersection of two key signal integrators in the cell: activator of G-protein signaling 3 and dishevelled-2.J Cell Sci. 2020 Sep 4;133(17):jcs247908. doi: 10.1242/jcs.247908. J Cell Sci. 2020. PMID: 32737219 Free PMC article.
-
RGS14 at the interface of hippocampal signaling and synaptic plasticity.Trends Pharmacol Sci. 2011 Nov;32(11):666-74. doi: 10.1016/j.tips.2011.07.005. Epub 2011 Sep 8. Trends Pharmacol Sci. 2011. PMID: 21906825 Free PMC article. Review.
-
Activator of G-Protein Signaling 3-Induced Lysosomal Biogenesis Limits Macrophage Intracellular Bacterial Infection.J Immunol. 2016 Jan 15;196(2):846-56. doi: 10.4049/jimmunol.1501595. Epub 2015 Dec 14. J Immunol. 2016. PMID: 26667172 Free PMC article.
References
-
- Takesono A, Cismowski MJ, Ribas C, Bernard M, Chung P, Hazard S, 3rd, Duzic E, Lanier SM. J Biol Chem. 1999;274:33202–33205. - PubMed
-
- Blatch GL, Lassle M. BioEssays. 1999;21:932–939. - PubMed
-
- Willard FS, Kimple RJ, Siderovski DP. Annu Rev Biochem. 2004;73:925–951. - PubMed
-
- Peterson YK, Bernard ML, Ma H, Hazard S, 3rd, Graber SG, Lanier SM. J Biol Chem. 2000;275:33193–33196. - PubMed
MeSH terms
Substances
LinkOut - more resources
Full Text Sources
Research Materials
Miscellaneous
