

National scientific facilities and their science impact on nonbiomedical research
- PMID: 17991781
- PMCID: PMC2084276
- DOI: 10.1073/pnas.0704416104
National scientific facilities and their science impact on nonbiomedical research
Abstract
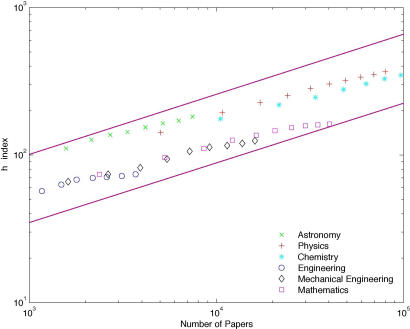
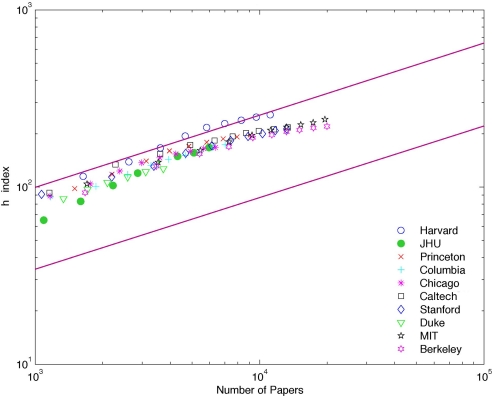
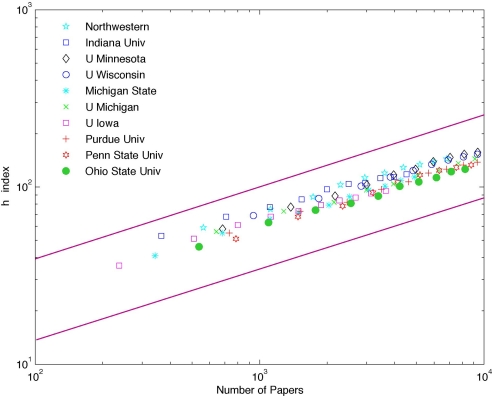
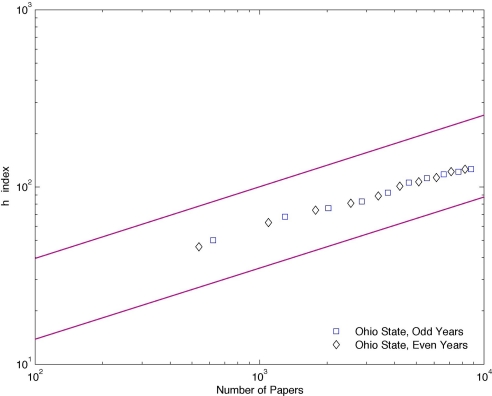
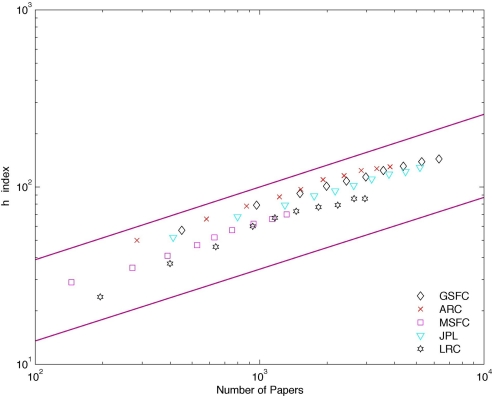
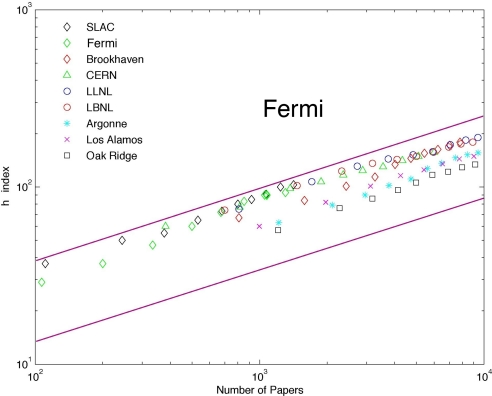
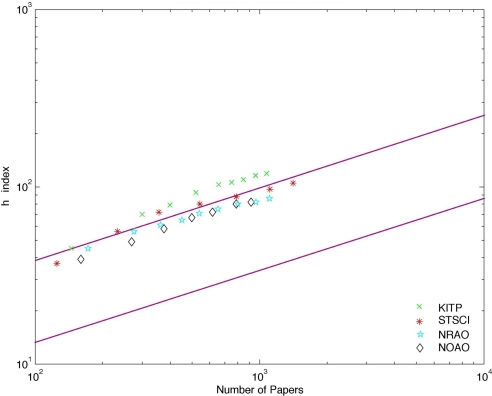
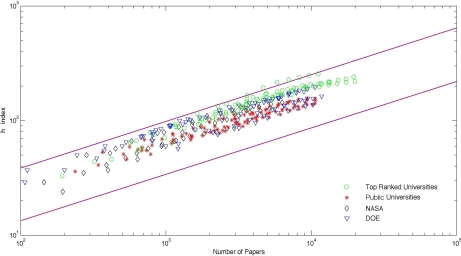
The "h index" proposed by Hirsch [Hirsch JE (2005) Proc Natl Acad Sci USA 102:16569-16573] is a good indicator of the impact of a scientist's research and has the advantage of being objective. When evaluating departments, institutions, or laboratories, the importance of the h index can be further enhanced when it is properly calibrated for the size of the group. Particularly acute is the issue of federally funded facilities whose number of actively publishing scientists frequently dwarfs that of academic departments. Recently, Molinari and Molinari [Molinari JF, Molinari A (2008) Scientometrics, in press] developed a methodology that shows that the h index has a universal growth rate for large numbers of papers, allowing for meaningful comparisons between institutions. An additional challenge when comparing large institutions is that fields have distinct internal cultures, with different typical rates of publication and citation; biology is more highly cited than physics, for example. For this reason, the present study has focused on the physical sciences, engineering, and technology and has excluded biomedical research. Comparisons between individual disciplines are reported here to provide a framework. Generally, it was found that the universal growth rate of Molinari and Molinari holds well across the categories considered, testifying to the robustness of both their growth law and our results. The goal here is to set the highest standard of comparison for federal investment in science. Comparisons are made of the nation's preeminent private and public institutions. We find that many among the national science facilities compare favorably in research impact with the nation's leading universities.
Conflict of interest statement
The author declares no conflict of interest.
Figures
Similar articles
-
Comparison of scientists of the Brazilian Academy of Sciences and of the National Academy of Sciences of the USA on the basis of the h-index.Braz J Med Biol Res. 2008 Apr;41(4):258-62. doi: 10.1590/s0100-879x2008000400001. Braz J Med Biol Res. 2008. PMID: 18392447
-
[Impact factor and/or Hirsch index?].Orv Hetil. 2007 May 6;148(18):849-52. doi: 10.1556/OH.2007.27942. Orv Hetil. 2007. PMID: 17468068 Hungarian.
-
The Pagerank-Index: Going beyond Citation Counts in Quantifying Scientific Impact of Researchers.PLoS One. 2015 Aug 19;10(8):e0134794. doi: 10.1371/journal.pone.0134794. eCollection 2015. PLoS One. 2015. PMID: 26288312 Free PMC article.
-
[Publication pressure and citation stress; the influence of achievement indicators on scientific practice].Ned Tijdschr Geneeskd. 2014;158:A7147. Ned Tijdschr Geneeskd. 2014. PMID: 24642121 Review. Dutch.
-
Highly cited articles in health care sciences and services field in Science Citation Index Expanded. A bibliometric analysis for 1958 - 2012.Methods Inf Med. 2014;53(6):446-58. doi: 10.3414/ME14-01-0022. Epub 2014 Oct 10. Methods Inf Med. 2014. PMID: 25301516 Review.
Cited by
-
Defining and identifying Sleeping Beauties in science.Proc Natl Acad Sci U S A. 2015 Jun 16;112(24):7426-31. doi: 10.1073/pnas.1424329112. Epub 2015 May 26. Proc Natl Acad Sci U S A. 2015. PMID: 26015563 Free PMC article.
-
Universality of citation distributions: toward an objective measure of scientific impact.Proc Natl Acad Sci U S A. 2008 Nov 11;105(45):17268-72. doi: 10.1073/pnas.0806977105. Epub 2008 Oct 31. Proc Natl Acad Sci U S A. 2008. PMID: 18978030 Free PMC article.
-
Assessing the impact of biomedical research in academic institutions of disparate sizes.BMC Med Res Methodol. 2009 May 29;9:33. doi: 10.1186/1471-2288-9-33. BMC Med Res Methodol. 2009. PMID: 19480665 Free PMC article.
-
Citation analysis of scientific categories.Heliyon. 2017 May 10;3(5):e00300. doi: 10.1016/j.heliyon.2017.e00300. eCollection 2017 May. Heliyon. 2017. PMID: 28560354 Free PMC article.
-
Faculty appointment and promotion in Taiwan's medical schools, a systematic analysis.BMC Med Educ. 2022 May 10;22(1):356. doi: 10.1186/s12909-022-03435-2. BMC Med Educ. 2022. PMID: 35538519 Free PMC article.
References
LinkOut - more resources
Full Text Sources
