

Multiple-state reactions between the epidermal growth factor receptor and Grb2 as observed by using single-molecule analysis
- PMID: 17991782
- PMCID: PMC2084288
- DOI: 10.1073/pnas.0701330104
Multiple-state reactions between the epidermal growth factor receptor and Grb2 as observed by using single-molecule analysis
Abstract
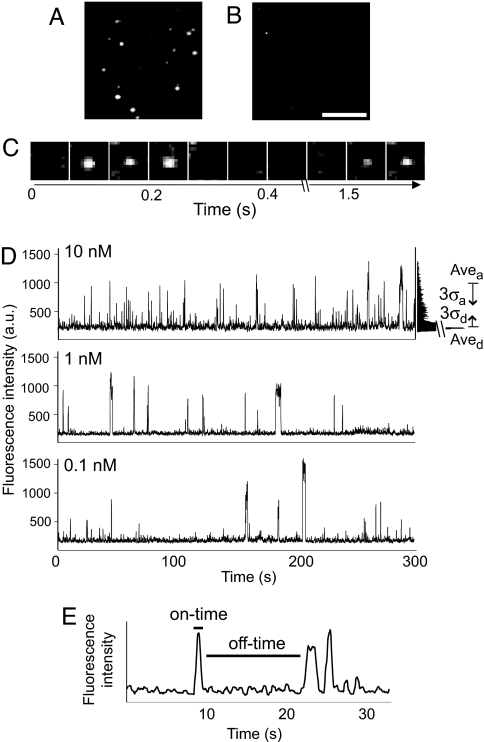
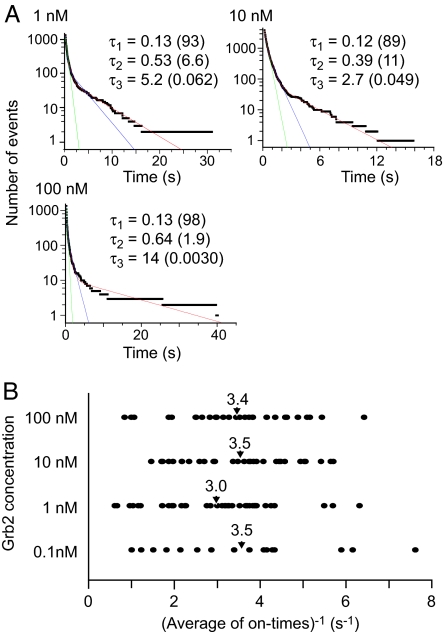
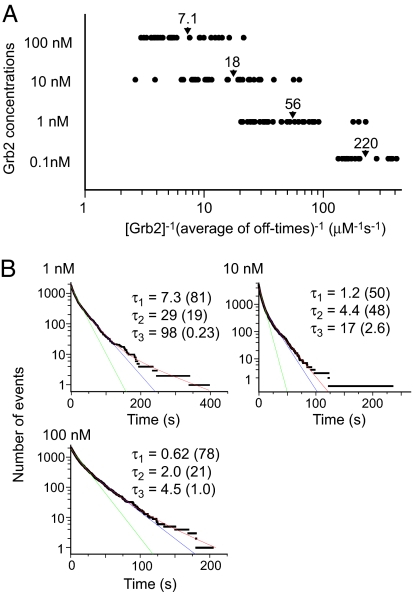
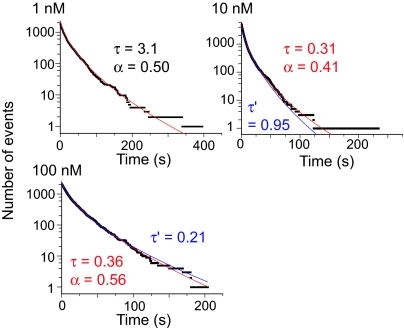
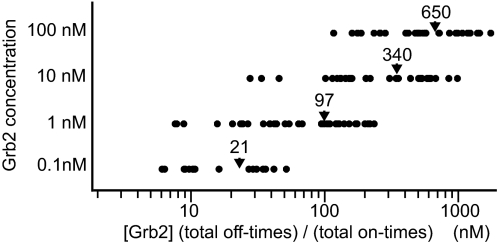
Phosphorylation of the cytoplasmic tyrosine residues of the epidermal growth factor receptor (EGFR) upon binding of EGF induces recognition of various intracellular signaling molecules, including Grb2. Here, the reaction kinetics between EGFR and Grb2 was analyzed by visualizing single molecules of Grb2 conjugated to the fluorophore Cy3 (Cy3-Grb2). The plasma membrane fraction was purified from human epithelial carcinoma A431 cells after stimulation with EGF and attached to coverslips. Unitary events of association and dissociation of Cy3-Grb2 on the EGFR in the membrane fraction were observed at different concentrations of Grb2 (0.1-100 nM). The dissociation kinetics could be explained by using a multiple-exponential function with a major (>90%) dissociation rate of 8 s(-1) and a few minor components, suggesting the presence of multiple bound states. In contrast, the association kinetics could be described by a stretched exponential function, suggesting the presence of multiple reaction channels from many unbound substates. Transitions between the unbound substates were also suggested. Unexpectedly, the rate of association was not proportional to the Grb2 concentration: an increase in Cy3-Grb2 concentration by a factor of 10 induced an increase in the reaction frequency approximately by a factor of three. This effect can compensate for fluctuation of the signal transduction from EGFR to Grb2 caused by variations in the expression level of Grb2 in living cells.
Conflict of interest statement
The authors declare no conflict of interest.
Figures
Similar articles
-
Live-cell fluorescence imaging reveals high stoichiometry of Grb2 binding to the EGF receptor sustained during endocytosis.J Cell Sci. 2014 Jan 15;127(Pt 2):432-44. doi: 10.1242/jcs.137786. Epub 2013 Nov 20. J Cell Sci. 2014. PMID: 24259669 Free PMC article.
-
Profiling epidermal growth factor receptor and heregulin receptor 3 heteromerization using receptor tyrosine kinase heteromer investigation technology.PLoS One. 2013 May 20;8(5):e64672. doi: 10.1371/journal.pone.0064672. Print 2013. PLoS One. 2013. PMID: 23700486 Free PMC article.
-
Hierarchy of binding sites for Grb2 and Shc on the epidermal growth factor receptor.Mol Cell Biol. 1994 Aug;14(8):5192-201. doi: 10.1128/mcb.14.8.5192-5201.1994. Mol Cell Biol. 1994. PMID: 7518560 Free PMC article.
-
Optical bioimaging: from living tissue to a single molecule: single-molecule visualization of cell signaling processes of epidermal growth factor receptor.J Pharmacol Sci. 2003 Nov;93(3):253-8. doi: 10.1254/jphs.93.253. J Pharmacol Sci. 2003. PMID: 14646241 Review.
-
Growth hormone-induced tyrosine phosphorylation of EGF receptor as an essential element leading to MAP kinase activation and gene expression.Endocr J. 1998 Apr;45 Suppl:S27-31. doi: 10.1507/endocrj.45.suppl_s27. Endocr J. 1998. PMID: 9790226 Review.
Cited by
-
Specificity and regulation of phosphotyrosine signaling through SH2 domains.J Struct Biol X. 2020 May 27;4:100026. doi: 10.1016/j.yjsbx.2020.100026. eCollection 2020. J Struct Biol X. 2020. PMID: 32647828 Free PMC article.
-
Time-resolved multimodal analysis of Src Homology 2 (SH2) domain binding in signaling by receptor tyrosine kinases.Elife. 2016 Apr 12;5:e11835. doi: 10.7554/eLife.11835. Elife. 2016. PMID: 27071344 Free PMC article.
-
Minute-scale persistence of a GPCR conformation state triggered by non-cognate G protein interactions primes signaling.Nat Commun. 2019 Oct 23;10(1):4836. doi: 10.1038/s41467-019-12755-9. Nat Commun. 2019. PMID: 31645561 Free PMC article.
-
Crosstalk of growth factor receptors at plasma membrane clathrin-coated sites.bioRxiv [Preprint]. 2024 May 18:2024.05.16.594559. doi: 10.1101/2024.05.16.594559. bioRxiv. 2024. PMID: 38903101 Free PMC article. Preprint.
-
Application of single-molecule analysis to singularity phenomenon of cells.Biophys Physicobiol. 2024 May 8;21(Supplemental):e211018. doi: 10.2142/biophysico.bppb-v21.s018. eCollection 2024. Biophys Physicobiol. 2024. PMID: 39175861 Free PMC article.
References
-
- Carpenter G, Cohen S. Annu Rev Biochem. 1979;48:193–216. - PubMed
-
- Ullrich A, Schlessinger J. Cell. 1990;61:203–212. - PubMed
-
- Yarden Y, Schlessinger J. Biochemistry. 1987;26:1443–1451. - PubMed
-
- Carpenter G, King L, Jr, Cohen S. Nature. 1978;276:409–410. - PubMed
-
- Cohen S, Carpenter G, King L., Jr J Biol Chem. 1980;255:4834–4842. - PubMed
Publication types
MeSH terms
Substances
LinkOut - more resources
Full Text Sources
Research Materials
Miscellaneous
