Comparative Study
. 2008 Feb;324(2):701-13.
doi: 10.1124/jpet.107.129734. Epub 2007 Nov 8.

Dose- and rate-dependent effects of cocaine on striatal firing related to licking

Affiliations
Comparative Study

Dose- and rate-dependent effects of cocaine on striatal firing related to licking

Chengke Tang et al. J Pharmacol Exp Ther. 2008 Feb.

Abstract

To examine the role of striatal mechanisms in cocaine-induced stereotyped licking, we investigated the acute effects of cocaine on striatal neurons in awake, freely moving rats before and after cocaine administration (0, 5, 10, or 20 mg/kg). Stereotyped licking was induced only by the high dose. Relative to control (saline), cocaine reduced lick duration and concurrently increased interlick interval, particularly at the high dose, but it did not affect licking rhythm. Firing rates of striatal neurons phasically related to licking movements were compared between matched licks before and after injection, minimizing any influence of sensorimotor variables on changes in firing. Both increases and decreases in average firing rate of striatal neurons were observed after cocaine injection, and these changes exhibited a dose-dependent pattern that strongly depended on predrug firing rate. At the middle and high doses relative to the saline group, the average firing rates of slow firing neurons were increased by cocaine, resulting from a general elevation of movement-related firing rates. In contrast, fast firing neurons showed decreased average firing rates only in the high-dose group, with reduced firing rates across the entire range for these neurons. Our findings suggest that at the high dose, increased phasic activity of slow firing striatal neurons and simultaneously reduced phasic activity of fast firing striatal neurons may contribute, respectively, to the continual initiation of stereotypic movements and the absence of longer movements.


Figures

Fig. 1
Fig. 1
At dose 20, stereotypic licking was induced by cocaine in T2 and subsequently reversed in T3 relative to predrug level in T1. Cocaine-induced stereotypy was assessed as the standardized change in the number of licks during water-off phases in T2 or T3 relative to T1. The left side of the y-axis represents the standardized value of change and right side represents 2-, 4-fold, etc., increase (>0) or decrease (<0) in T2 or T3 relative to T1. Horizontal line at 0 represents no change from T1. Numbers of recording sessions included in this analysis were nine, five, six, and five at doses 0, 5, 10, and 20, respectively. A, stereotypy in T2. Rats at dose 20 exhibited significantly greater increases in number of water-off licks (mean ± S.E.M.) from T1 to T2 than rats at dose 0 (*, p < 0.05). B, reversal in T3. Relative to T1, rats at dose 20 exhibited significantly lower number of water-off licks in T3 than in T2 (†, p < 0.05).
Fig. 2
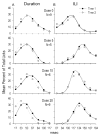
Fig. 2
Dose-dependent changes in lick duration and interlick interval. A, cocaine-induced shift of licks toward shorter duration as a function of dose in T2. The x-axis represents seven levels of lick duration from 17 to 117 ms, and the y-axis represents percentage of licks in each level. Each dot represents mean percentage of licks in each level across all recording sessions at each dose in T1 (closed circle) or T2 (open circle). For each dose, two spline curves were fitted for data points in T1 and T2 separately. As dose increased (top through bottom), there were significantly increased licks with shorter durations and simultaneously decreased licks with longer durations in T2, relative to T1 (p < 0.05). B, cocaine-induced shift in proportion of licks toward longer ILI as a function of dose in T2. The x-axis represents eight levels of lick ILI from 67 to 184 ms, and the y-axis represents the percentage of licks in each level. For better display, licks in levels shorter than 67 and in levels longer than 184 were merged into the levels of 67 and 184, respectively, due to very low proportions of licks in these levels. As dose increased, there were significantly increased licks with longer ILI and simultaneously decreased licks with shorter ILI in T2, relative to T1 (p < 0.05). Number of recording sessions is shown in the middle of each row (dose).
Fig. 3
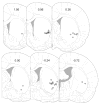
Fig. 3
Locations of all 70 neurons. Every striatal neuron related to licking was verified histologically to be located in the ventrolateral region of the striatum. Circles, single neurons; squares, several different single neurons histologically placed at the same location. Numbers on coronal plates indicate anterior-posterior distance from bregma (Paxinos and Watson, 2005).
Fig. 4
Fig. 4
Dose- and rate-dependent pattern of clockwise rotation of the regression lines on average firing rates of neurons between T1 and T2 across doses. In each scatterplot, the average firing rates of neurons in T2 (y-axis, log10-transformed) are regressed on their average firing rates in T1 (x-axis, log10-transformed) for each dose. Each dot represents one neuron. The solid line represents the linear regression line, and the broken diagonal line represents no change of the average firing rates from T1 to T2. As dose increased (A–D), the regression lines gradually rotated clockwise away from the diagonal line of no change with decreasing slopes, consistent with the significant (p < 0.05) dose- and rate-dependent effects of cocaine on average firing rates revealed by HLM. The strong linearity of regression at doses 0, 5, and 10 (p < 0.001) was absent at dose 20 (p < 0.05).
Fig. 5
Fig. 5
Changes in average firing rates of representative slow and fast firing neurons following cocaine administration. A, increase in average firing rate in T2 and reversal in T3 of a representative slow firing neuron at dose 10. Slow firing neurons were defined as those with average firing rate in T1 less than 1 impulses/s. The y-axis of each perievent histogram represents average firing rate (impulses per second). Time 0 of the x-axis indicates the beginning of lick. Top, in T1, the neuron showed lick-related activity from −20 to + 65 ms, relative to beginning of lick. Dashed vertical lines indicate this customized time window of firing for this neuron that was applied to T1, T2, and T3. Middle, in T2, the same neuron showed increased activity during the same time window. Bottom, in T3, the same neuron’s activity showed reversal to T1 level during the same time window. The average firing rate of this neuron increased from 0.16 in T1 to 0.64 in T2 and then reversed to 0.29 in T3. Each histogram displays neural activity associated with identical number of 1000 licks in each time epoch. Calibration, 0.15 mV; 0.2 ms. B, decrease in average firing rate in T2 and reversal in T3 of a representative fast firing neuron at dose 20. Fast firing neurons were defined as those with average firing rate in T1 greater than 1 impulses/s. Top, in T1, the neuron showed lick-related activity from −30 ms to beginning of lick. This time window of firing (indicated by dashed vertical lines) applied to all three time epochs of the recording session. Middle, in T2, the same neuron showed decreased activity during the same time window. Bottom, in T3, the same neuron’s activity showed reversal to T1 level during the same time window. The average firing rate (impulses per second) of this neuron decreased from 7.73 in T1 to 2.75 in T2 and then reversed to 10.02 in T3. Each histogram displays neural activity associated with identical number of 941 licks in each time epoch. See Table 1 for matched pairs of this neuron. Calibration, 0.1 mV; 0.2 ms. For both representative neurons, the overlaid waveforms in each time epoch are shown on top left of each histogram. Raster above each histogram displays neural activity on a trial-by-trial basis in chronological order from the bottom to the top of each raster. T3 rasters (Recovery) illustrate that firing rates continually approached T1 levels as T3 progressed.
Fig. 6
Fig. 6
Dose- and rate-dependent effects of cocaine on the firing rates of matched pairs within neurons. The standardized value of change in firing rate of each matched pair was calculated by [(T2FR/(T1FR + T2FR)) − 0.5)]. The top and bottom graphs illustrate the modeling results of ANCOVA for matched pairs of slow and fast firing neurons, respectively. In each graph, at each dose, the black and white bars show the mean of standardized changes in firing rates of low and high T1FR matched pairs across neurons, respectively. Error bars, represent the S.E.M.s. Left side of y-scale represents the standardized change in firing rate, and the right side represents 2-, 4-fold, etc., changes in firing rate in T2, relative to T1. Horizontal line at 0 represents no change in firing rate from T1. *, p < 0.001, post-hoc Bonferroni tests compared with dose 0.
Fig. 7
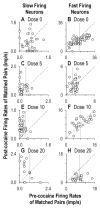
Fig. 7
Changes in firing rates of matched pairs from T1 to T2 within individual neurons. Eight neurons are presented. Each row consists of two representative neurons from one dose; one represents slow firing neurons (left column), and the other represents fast firing neurons (right column). Each scatterplot represents one neuron, and each dot represents one matched pair. In each scatterplot, the x- and y-axis are equivalent in scale, customized to the ranges of firing rates of matched pairs in T1 and T2 for each neuron. The vertical dotted line indicates the middle of the range of firing rates of matched pairs in T1, used as the cut point to dichotomize matched pairs into low and high T1FR groups within each neuron. The diagonal broken line indicates a reference line of no change; thus, above it increased FR, and below it decreased FR from T1 to T2.

Similar articles

Cited by

References

    1. Bamford NS, Zhang H, Schmitz Y, Wu NP, Cepeda C, Levine MS, Schmauss C, Zakharenko SS, Zablow L, Sulzer D. Heterosynaptic dopamine neurotransmission selects sets of corticostriatal terminals. Neuron. 2004;42:653–663. - PubMed
    1. Bhattacharyya AK, Pradhan SN. Interactions between motor activity and stereotypy in cocaine-treated rats. Psychopharmacology. 1979;63:311–312. - PubMed
    1. Brozek G, Zhuravin IA, Megirian D, Bures J. Localization of the central rhythm generator involved in spontaneous consummatory licking in rats: functional ablation and electrical brain stimulation studies. Proc Natl Acad Sci U S A. 1996;93:3325–3329. - PMC - PubMed
    1. Bryk AS, Raudenbush SW. Hierarchical Linear Models: Applications and Data Analysis Methods. Sage Publications; Thousand Oaks, CA: 2002.
    1. Cho J, West MO. Distribution of single neurons related to body parts in the lateral striatum of the rat. Brain Res. 1997;756:241–246. - PubMed

Publication types

LinkOut - more resources