. 2007 Nov 30;318(5855):1469-72.
doi: 10.1126/science.1151710. Epub 2007 Nov 8.

The obesity-associated FTO gene encodes a 2-oxoglutarate-dependent nucleic acid demethylase

Affiliations

The obesity-associated FTO gene encodes a 2-oxoglutarate-dependent nucleic acid demethylase

Thomas Gerken et al. Science. .

Abstract

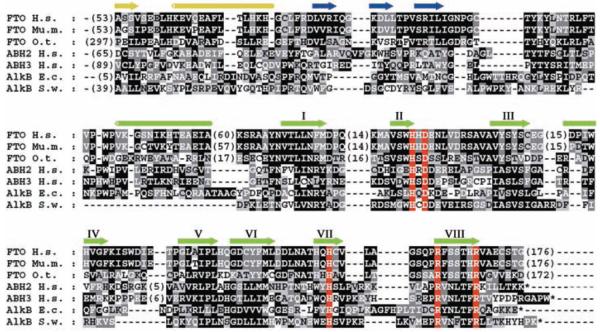
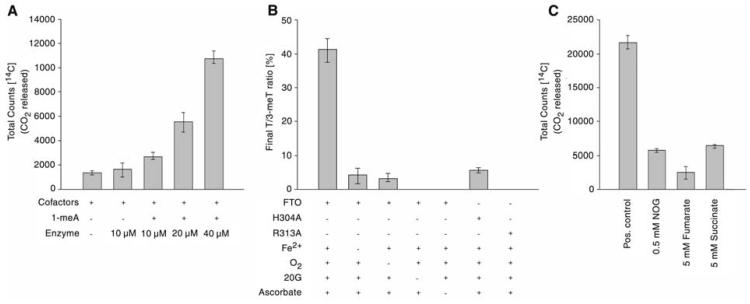
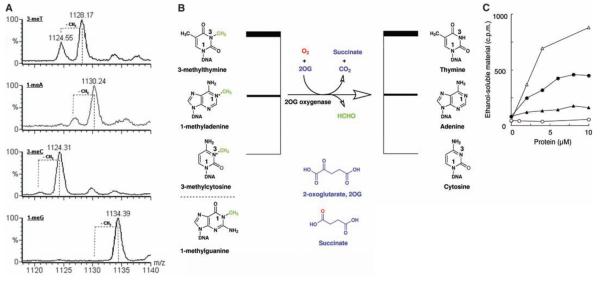
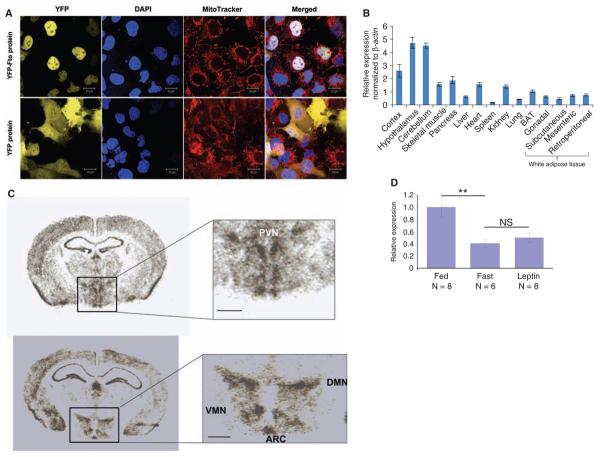
Variants in the FTO (fat mass and obesity associated) gene are associated with increased body mass index in humans. Here, we show by bioinformatics analysis that FTO shares sequence motifs with Fe(II)- and 2-oxoglutarate-dependent oxygenases. We find that recombinant murine Fto catalyzes the Fe(II)- and 2OG-dependent demethylation of 3-methylthymine in single-stranded DNA, with concomitant production of succinate, formaldehyde, and carbon dioxide. Consistent with a potential role in nucleic acid demethylation, Fto localizes to the nucleus in transfected cells. Studies of wild-type mice indicate that Fto messenger RNA (mRNA) is most abundant in the brain, particularly in hypothalamic nuclei governing energy balance, and that Fto mRNA levels in the arcuate nucleus are regulated by feeding and fasting. Studies can now be directed toward determining the physiologically relevant FTO substrate and how nucleic acid methylation status is linked to increased fat mass.


Figures

Fig. 1
Fig. 1
Multiple sequence alignment of FTO from human (Homo sapiens; Hs), mouse (Mus musculus; Mm) and green algae (Ostreococcus tauri; Ot) with Escherichia coli (Ec) and Shewanella woodyi (Sw) AlkB and human ABH2 and ABH3. A comparison of Ot FTO with the nonredundant protein sequence database at the National Center for Biotechnology Information using PSI-BLAST (28) revealed significant similarity (E < 0.005) between human FTO, bacterial AlkB, and its human homologs, within two iterations. Conserved residues highlighted in red are histidine and carboxylate (Asp or Glu) Fe(II) binding residues of 2OG oxygenases (His-228/231, Asp-230/233, and His-304/307 in murine Fto/human FTO, respectively), as well as an arginine (Arg-313/316), which binds the 2OG C-5 carboxylate in a 2OG oxygenase subfamily (7, 8). The cylinders and arrows represent α helices and β strands, respectively, assigned as in a crystal structure of ABH3 (29). Secondary structure in yellow represents the N-terminal region, blue strands represent an assigned (29) substrate binding lid for ABH3, green strands labeled with roman numerals identify the eight β strands that form the conserved double-stranded beta-helix of the 2OG oxygenases. GenInfo numbers: human FTO: 122937263; mouse Fto: 6753916; green algae FTO: 116060758; human ABH2: 48717226; human ABH3: 21040275; E. coli AlkB: 113638; S. woodyi AlkB: 118070714.
Fig. 2
Fig. 2
Fto is a 2-oxoglutarate–dependent DNA demethylase in vitro. (A) Demethylation of 1-meA is dependent on Fto in 2OG decarboxylation assays; (B) Cofactor/cosubstrate dependence of FTO activity on a 3-meT substrate shown by LC-MS. Data shown represent ratios of thymine to 3-meT in ss-DNA. The oxygen control reaction was carried out in an atmosphere of <1% O2; (C) Inhibition of Fto-catalyzed 1-meA demethylation in 2OG decarboxylation assays. All assays were performed in triplicate, at least, with error bars denoting ±SD.
Fig. 3
Fig. 3
In vitro activity of Fto with ss-DNA substrates. (A) Demethylation of ss-DNA substrates by Fto. LC-MS data for the incubation of synthetic 15-nucleotide oligomers of the form 5′-TT(methylated base)TTTTTTTTTTTT-3′ with Fto, cofactors, and cosubstrates; positions of expected peaks for demethylated substrates are indicated by dotted lines. Smaller peaks at higher masses than reactant peaks probably arise from Na+ and K+ adducts of the methylated oligonucleotides. m/z = mass-to-charge ratio, shown in units of Dalton. (B) Stoichiometry of the Fto reaction. (C) Release of formaldehyde from methylated poly(dA) and poly(dT). FTO and ABH3 were assayed for demethylase activity by incubation with [14C]-methylated poly(dA) or [14C]-methylated poly(dT) [total counts per minute (c.p.m.) 1000 or 800, respectively] at 37°C for 15 min. Release of ethanol-soluble [14C]-formaldehyde was monitored. FTO -○-, -●-; ABH3 -∆-, -▲-. [14C]-methylated poly(dA) -○-, -∆-; [14C]-methylated poly(dT) -●-, -▲-. In the absence of 2OG, no significant activity was detected; the ethanol soluble material released by FTO or ABH3 was at background level (less than 100 c.p.m).
Fig. 4
Fig. 4
Expression studies of Fto protein and mRNA in mice. (A) Subcellular localization of murine Fto in COS-7 cells. Confocal fluorescence images of COS-7 cells expressing YFP-Fto or YFP show YFP-Fto localizing to the nucleus. Nuclei were visualized with 4′,6-diamidino-2-phenylindole (DAPI) staining and mitochondria with MitoTracker. Colocalization of YFP (yellow) and DAPI (blue) in the merged images produces a white signal. (B) Relative expression of Fto mRNA in different tissues. Bar graphs show the relative expression of Fto mRNA normalized to β actin across a panel of different tissues. Data are represented as the mean (±SE) of six independent mice per tissue. (C) In situ hybridization of murine Fto in brain. PVN, paraventricular nucleus; VMN, ventromedial nucleus; DMN, dorsomedial nucleus; ARC, arcuate nucleus; scale bar = 500 μm. (D) Nutritional regulation of Fto mRNA expression in ARC. Bar graphs show the change in expression of Fto mRNA in the arcuate nucleus of the hypothalamus in the fed, fasted, and leptin-treated-while-fasted state. Response is expressed in terms of fold induction of the fasted and leptin-treated expression over the fed expression. The P value was calculated using a two-tailed distribution unpaired Student's t test. **P < 0.01. Data are represented as the mean (±SE) of at least six independent mice per group.

Similar articles

Cited by

References

    1. Dina C, et al. Nat. Genet. 2007;39:724. - PubMed
    1. Frayling TM, et al. Science. 2007;316:889. - PMC - PubMed
    1. Scott LJ, et al. Science. 2007;316:1341. - PMC - PubMed
    1. Scuteri A, et al. PLoS Genetics. 2007;3:e115. - PMC - PubMed
    1. Peters T, Ausmeier K, Dildrop R, Rüther U. Mamm. Genome. 2002;13:186. - PubMed

Publication types

MeSH terms