. 2007 Nov 9;318(5852):980-5.
doi: 10.1126/science.1147851.

Magnetic resonance spectroscopy identifies neural progenitor cells in the live human brain

Affiliations

Magnetic resonance spectroscopy identifies neural progenitor cells in the live human brain

Louis N Manganas et al. Science. .

Abstract

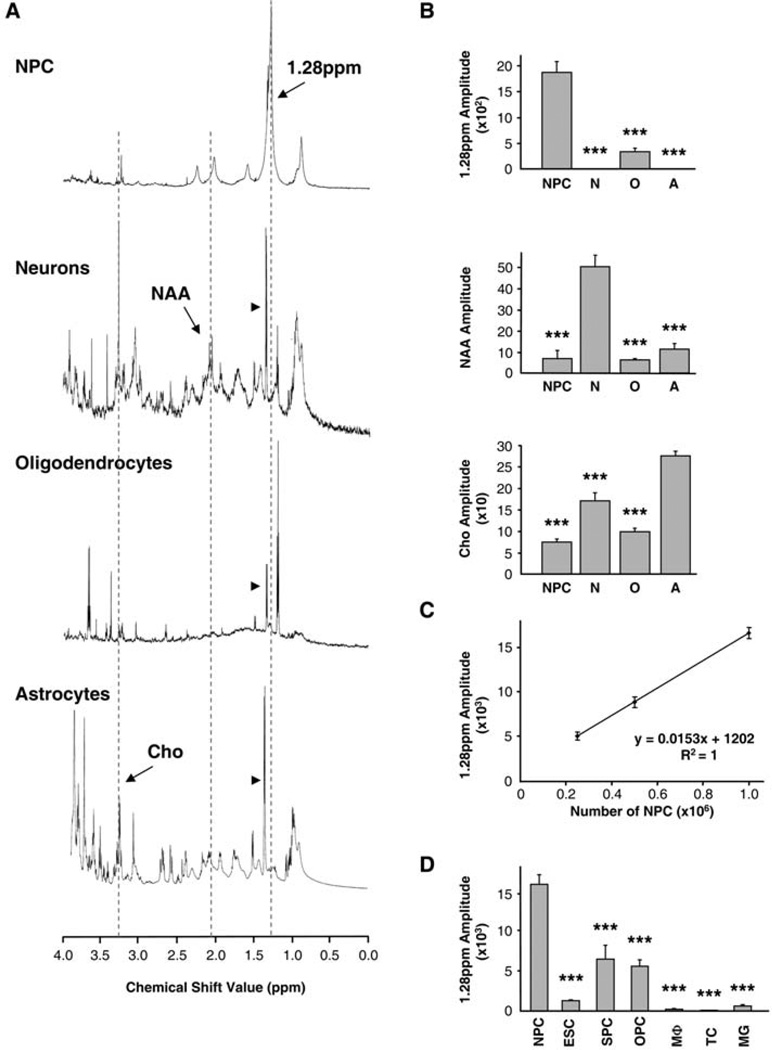
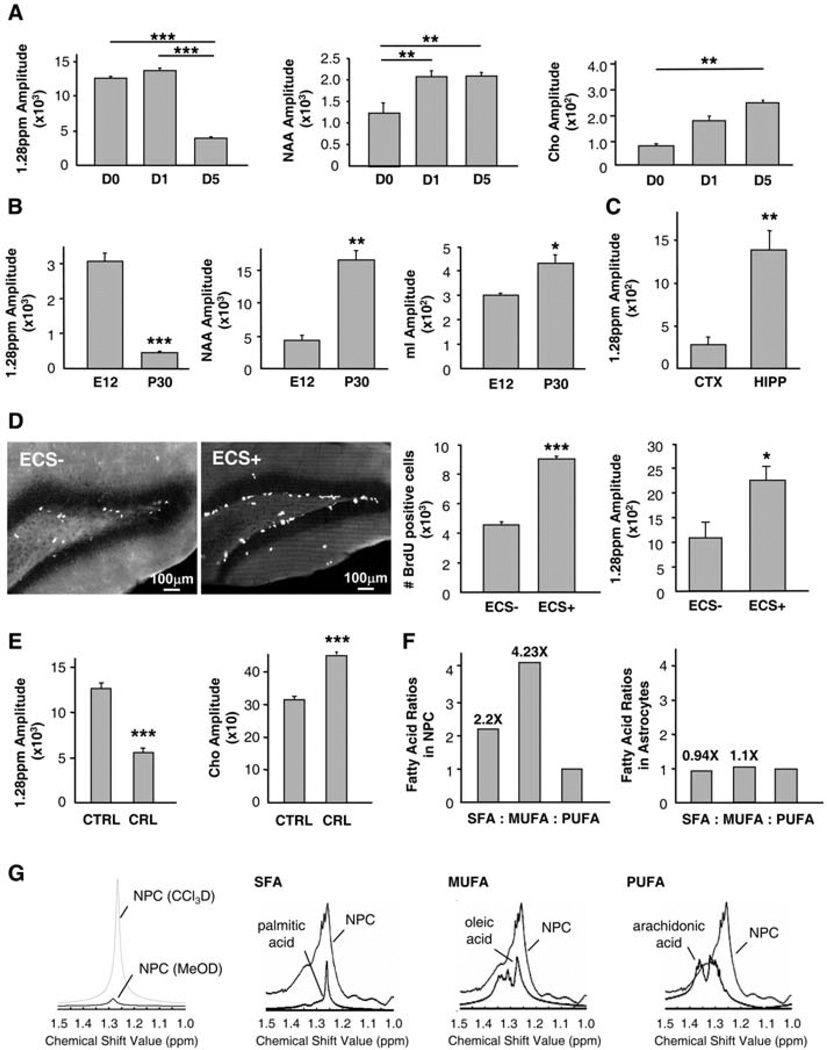
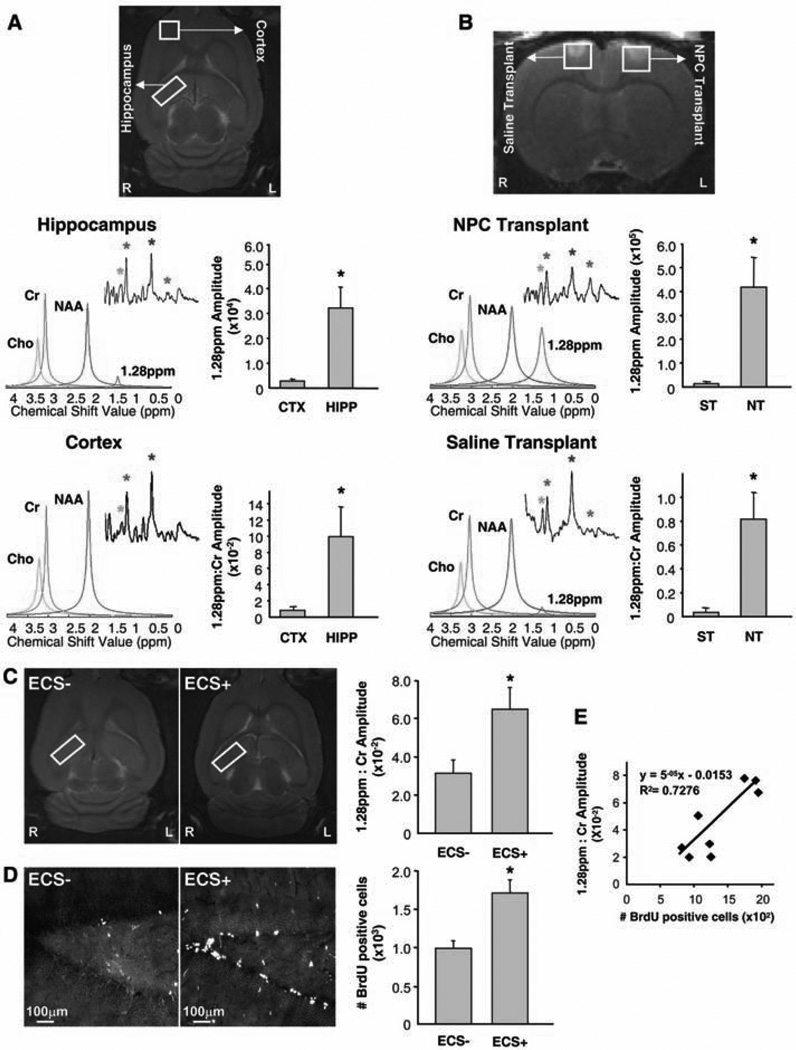
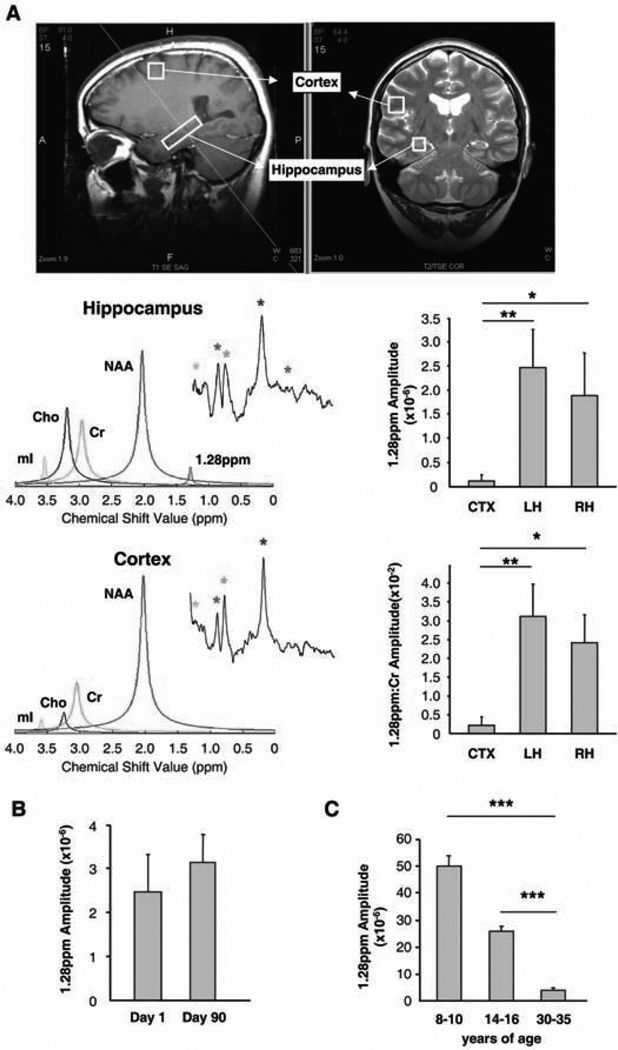
The identification of neural stem and progenitor cells (NPCs) by in vivo brain imaging could have important implications for diagnostic, prognostic, and therapeutic purposes. We describe a metabolic biomarker for the detection and quantification of NPCs in the human brain in vivo. We used proton nuclear magnetic resonance spectroscopy to identify and characterize a biomarker in which NPCs are enriched and demonstrated its use as a reference for monitoring neurogenesis. To detect low concentrations of NPCs in vivo, we developed a signal processing method that enabled the use of magnetic resonance spectroscopy for the analysis of the NPC biomarker in both the rodent brain and the hippocampus of live humans. Our findings thus open the possibility of investigating the role of NPCs and neurogenesis in a wide variety of human brain disorders.


Figures

Fig. 1
Fig. 1
The 1.28-ppm biomarker identifies NPCs. (A) Spectral profiles of cultured neural cell types: NPCs, neurons, oligodendrocytes, and astrocytes. Dotted lines outline the 1.28-ppm NPC peak, NAA (2.02 ppm), and Cho (3.23 ppm). Arrowheads denote lactate doublets (1.33 ppm). Spectra are not of equal scale. (B) Bar graphs show quantification of the 1.28-ppm biomarker (top), NAA (middle), and Cho (bottom) (2.5 × 10⁵ cells each, n = 3 experiments per group, done in triplicate samples per experiment). N, neurons, O, oligodendrocytes, A, astrocytes. (C) Quantification of the 1.28-ppm biomarker shows correlation of the number of NPCs and the 1.28-ppm signal amplitude (n = 3 experiments per data point, done in triplicate samples per experiment). (D) Quantification of the 1.28-ppm biomarker in proliferating cells: NPCs, ESCs, SPCs, OPCs, macrophages (MΦ), T lymphocytes (TC), and microglia (MG) (1 × 10⁶ each, n = 3 experiments per group, done in triplicate samples per experiment). For all figures, quantification was done with the SVD-based method; bar graphs represent mean ± SEM; *, P < 0.05; **, P < 0.01; ***, P < 0.001. Detailed statistics are provided in the supporting online material.
Fig. 2
Fig. 2
Analysis of the specificity and molecular composition of the NPC biomarker using 1H-NMR. (A) Quantification of NPC, neuronal (NAA), and glial (Cho) biomarkers during in vitro differentiation, at 0, 1, and 5 days (D) after neurosphere plating (1 × 10⁶ cells per time point, n = 3 experiments per time point, done in triplicate samples per experiment). (B) Quantification of NPC, neuronal (NAA,) and glial (mI) biomarkers in whole-brain homogenates at E12 and P30 (1 × 10⁶ cells per time point, n = 3 experiments per time point, done in triplicate samples per experiment). (C) Quantification of the NPC biomarker in the dissociated adult mouse cortex (CTX) and hippocampus (HIPP) (1 × 10⁶ cells per group, n = 3 experiments per group, done in triplicate samples per experiment). (D) ECS increases both the number of BrdU-immunoreactive cells (n = 3 experiments; P < 0.01) and the 1.28-ppm biomarker (n = 3 experiments; P < 0.05) in the mouse hippocampus. (E) The 1.28-ppm biomarker diminishes while Cho increases upon blockade of fatty acid synthesis with cerulenin (CRL) (n = 3 experiments per group, done in triplicate samples per experiment, P < 0.001). (F) SFAs and MUFAs are more abundant in NPCs than in astrocytes (n = 1). (G) The 1.28-ppm biomarker belongs to a chloroform (CCl3D) and not methanol (MeOD) fraction. It overlaps with SFAs and MUFAs rather than PUFAs.
Fig. 3
Fig. 3
Identification of NPCs in the rat brain in vivo, using mMRI spectroscopy. (A) Imaging of endogenous NPCs. Voxels are placed along the hippocampus (HIPP) and in the cortex (CTX). In the hippocampus, the 1.28-ppm biomarker (red) is evident when SVD-based signal processing is performed (colored peaks) but not when Fourier transform is done (insets). In the cortex, the 1.28-ppm biomarker is not detected by either data analysis. Colored asterisks and peaks correlate. Bar graphs show absolute (top) and relative (bottom) quantification of the 1.28-ppm biomarker (n = 4 experiments, P < 0.05). (B) Imaging of transplanted NPCs. Voxels are placed in the area of NPC transplant (NT; 5 × 10⁶ NPCs in 5 ml of saline) and saline injection (ST; 5 µl). In the NT site, the 1.28-ppm biomarker (red) is observed with both Fourier transform and SVD-based signal processing. In the ST site, no significant 1.28-ppm signal is observed. Bar graphs show absolute (top) and relative (bottom) quantification of the 1.28-ppm biomarker (n = 5 experiments; P < 0.05). (C and D) Imaging of endogenous NPCs after ECS. Voxels are placed along the hippocampus in control (ECS−) and ECS-treated (ECS+) adult rats (C). Quantification of the 1.28-ppm biomarker [(C) n = 4 experiments, P < 0.05] and the number of BrdU-immunoreactive cells in the dentate gyrus of the same animal [(D) n = 4 experiments, P < 0.01] indicates linear correlation (E).
Fig. 4
Fig. 4
Identification of NPCs in the human hippocampus in vivo, using 1H-MRS. (A) Voxels are placed along the hippocampus and in the cortex. In the hippocampus, the 1.28-ppm biomarker (red) is evident when SVD-based signal processing is performed but not when Fourier transform is done. In the cortex, the 1.28-ppm biomarker is not detected by either data analysis. Colored asterisks and colored peaks correlate. Bar graphs show absolute (top) and relative (bottom) quantification of the 1.28-ppm biomarker (CTX, cortex; LH, left hippocampus; RH, right hippocampus; n = 5people; P < 0.01 and P < 0.05, respectively). (B) Quantification of the 1.28-ppm biomarker in the adult human hippocampus over time (n = 4 people, P = 0.747). The same people were imaged 90 days apart. (C) Quantification of the 1.28-ppm biomarker in the human hippocampus during development in preadolescent, adolescent, and adult age groups (n = 3 people per group; P < 0.001).

Comment in

References

    1. Lie DC, Song H, Colamarino SA, Ming GL, Gage FH. Annu. Rev. Pharmacol. Toxicol. 2004;44:399. - PubMed
    1. Ming GL, Song H. Annu. Rev. Neurosci. 2005;28:223. - PubMed
    1. Curtis MA, et al. Science. 2007;315:1243. - PubMed
    1. Goldman SA, Windrem MS. Philos. Trans. R. Soc. London Ser. B. 2006;361:1463. - PMC - PubMed
    1. Cicchetti F, et al. Contrast Media Mol. Imaging. 2007;2:130. - PubMed

Publication types

MeSH terms