. 2007 Dec;117(12):4034-43.
doi: 10.1172/JCI32994.

Probing cell type-specific functions of Gi in vivo identifies GPCR regulators of insulin secretion

Affiliations

Probing cell type-specific functions of Gi in vivo identifies GPCR regulators of insulin secretion

Jean B Regard et al. J Clin Invest. 2007 Dec.

Abstract

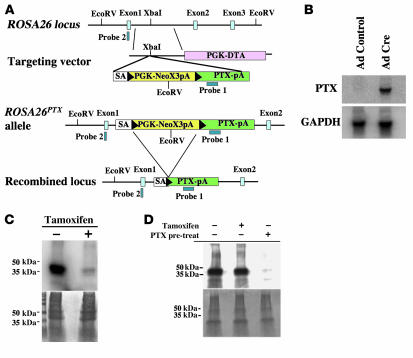
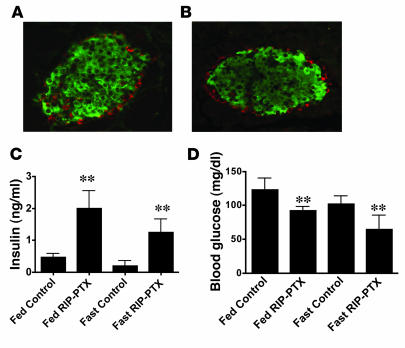
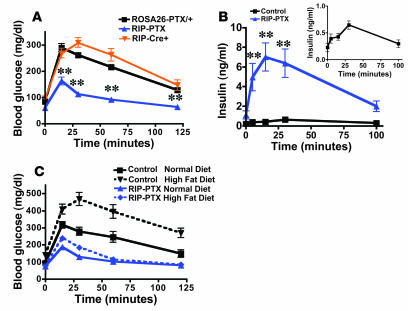
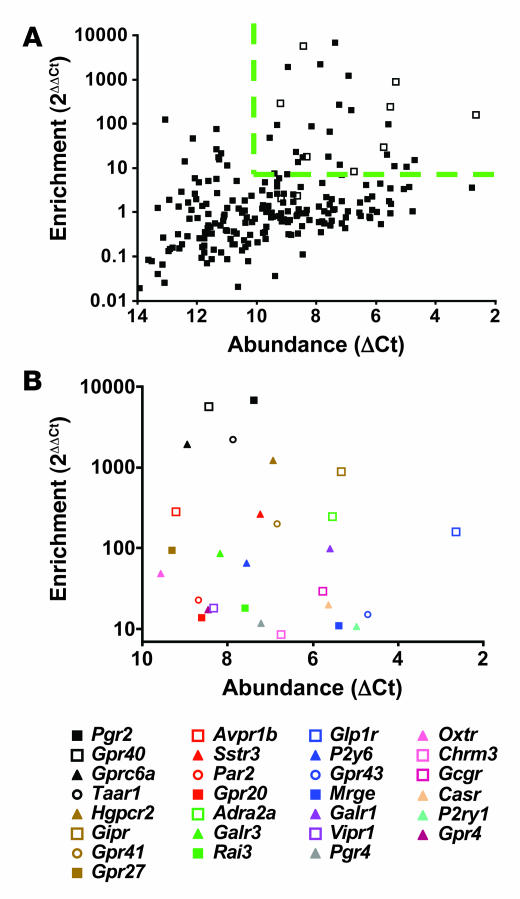
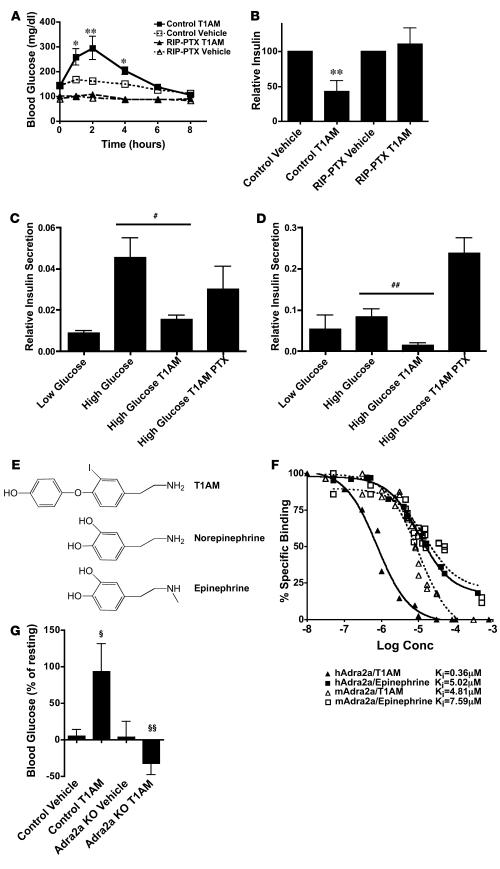
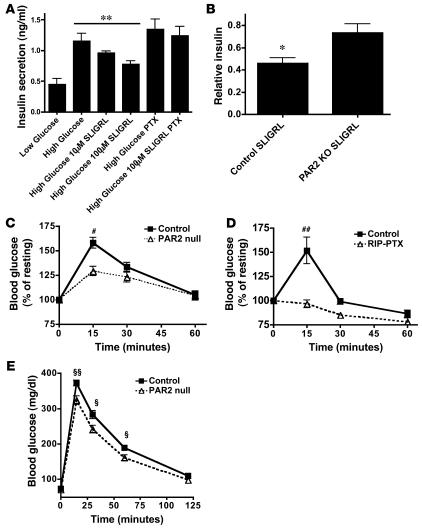
The in vivo roles of the hundreds of mammalian G protein-coupled receptors (GPCRs) are incompletely understood. To explore these roles, we generated mice expressing the S1 subunit of pertussis toxin, a known inhibitor of G(i/o) signaling, under the control of the ROSA26 locus in a Cre recombinase-dependent manner (ROSA26(PTX)). Crossing ROSA26(PTX) mice to mice expressing Cre in pancreatic beta cells produced offspring with constitutive hyperinsulinemia, increased insulin secretion in response to glucose, and resistance to diet-induced hyperglycemia. This phenotype underscored the known importance of G(i/o) and hence of GPCRs for regulating insulin secretion. Accordingly, we quantified mRNA for each of the approximately 373 nonodorant GPCRs in mouse to identify receptors highly expressed in islets and examined the role of several. We report that 3-iodothyronamine, a thyroid hormone metabolite, could negatively and positively regulate insulin secretion via the G(i)-coupled alpha(2A)-adrenergic receptor and the G(s)-coupled receptor Taar1, respectively, and protease-activated receptor-2 could negatively regulate insulin secretion and may contribute to physiological regulation of glucose metabolism. The ROSA26(PTX) system used in this study represents a new genetic tool to achieve tissue-specific signaling pathway modulation in vivo that can be applied to investigate the role of G(i/o)-coupled GPCRs in multiple cell types and processes.


Figures

Figure 1
Figure 1. Generation and characterization of the conditional ROSA26PTX allele.
(A) Diagram of the wild-type ROSA26 locus, the ROSA26PTX targeting vector, the ROSA26PTX allele, and Cre-recombined locus. Black arrowheads represent LoxP sites. (B) Cre-dependent expression of PTX S1 mRNA. RNA from endothelial cells that were isolated from ROSA26PTX mice and then infected with Cre- or GFP-expressing (control) adenovirus was analyzed by Northern blot. Blots were hybridized with probe for PTX S1 and for GAPDH mRNA to assess loading. (C) Cre-dependent ADP-ribosylation of Gαi/o. Fibroblasts from ROSA26PTX mouse embryos carrying a CMV-IE-ER-Cre transgene were incubated with or without 1 μM 4-hydroxy-tamoxifen for 4 days to induce Cre expression, ROSA26PTX recombination, and expression of PTX S1. Membranes from these cells were incubated with the ADP-ribose donor [32P]NAD and exogenous pertussis toxin, then analyzed by SDS-PAGE and autoradiography (upper panel) or stained for protein loading (lower panel). Note the absence of Gαi/o available for in vitro labeling in membranes from tamoxifen-induced cells, indicating that ADP-ribosylation of Gαi/o had already occurred in vivo. (D) Cell-autonomous function of ROSA26PTX. Mouse thymocytes were cocultured with Cre-expressing ROSAPTX mouse embryonic fibroblasts (MEFs; as in Figure 1C). Where indicated (+pre-treat), thymocytes were treated with pertussis holotoxin (50 ng/ml). After 8 hours of coculture, thymocytes were isolated, and their membrane fractions were assayed for Gαi/o available for in vitro ADP-ribosylation as in Figure 1C. Note that coculture of thymocytes with PTX S1–expressing MEFs did not cause detectable loss of ADP-ribosylatable Gαi/o, but addition of exogenous holotoxin did.
Figure 2
Figure 2. Anatomically normal islets, hyperinsulinemia, and hypoglycemia in RIP-PTX mice.
(A and B) Immunofluorescent staining of pancreas sections from control (A) and RIP-PTX (B) mice for insulin (green; β cells) and glucagon (red; α cells) (original magnification, ×20). Islet size, morphology, and cellular composition and number were unchanged in RIP-PTX mice. (C) Plasma insulin levels in 8- to 10-week-old RIP-PTX mice and littermate controls (n = 8–11; **P < 0.001); mice were fed ad libitum or fasted overnight as indicated. Plasma insulin levels were elevated in RIP-PTX under both fed and fasted conditions. (D) Blood glucose levels in RIP-PTX mice and littermate controls (n = 8–11; **P < 0.001). RIP-PTX mice were hypoglycemic under both fed and fasted conditions.
Figure 3
Figure 3. RIP-PTX mice show improved glucose tolerance and resistance to high-fat diet–induced hyperglycemia.
(A) IPGTT in 8- to 10-week-old male RIP-PTX mice, littermate controls, and age-matched, background-matched RIP-cre mice. Glucose (2 mg/g) was administered i.p. at time 0, and plasma glucose was measured at the indicated time points. Note the lower glucose levels in RIP-PTX mice compared with controls (n = 9–10; **P < 0.0001). (B) GSIS. Glucose was administered at 3 mg/g i.p. to mice as in A, and plasma insulin levels were measured at the indicated times. Note the 6.5-fold increase over already elevated basal levels in RIP-PTX mice compared with a 3-fold increase in controls (inset) (n = 7–8; **P < 0.0001). (C) IPGTT in RIP-PTX mice and littermate controls fed a normal or high-fat diet for 30 weeks. RIP-PTX mice fed a high-fat diet had glucose levels significantly lower than controls on a high-fat diet (n = 8–11; P < 0.0001) and lower than controls on a normal diet (n = 8–10; P = 0.007).
Figure 4
Figure 4. GPCR expression in isolated mouse pancreatic islets.
(A) RNA from freshly isolated mouse pancreatic islets was reversed transcribed and subjected to qRT-PCR analysis for each of 373 nonodorant GPCRs annotated in the mouse genome. Abundance of each GPCR mRNA relative to 3 internal controls (β-actin, cyclophilin, GAPDH) in islets [Abundance (ΔCt)] and abundance of each GPCR in islets relative to abundance in a mixed tissue pool [Enrichment (2ΔΔCt)] are shown. Open squares indicate receptors known to be physiologically important regulators of insulin secretion. (B) Identity of the 28 receptors most highly expressed and enriched in islets as demarcated by the dashed line in A (see also Table 1). Open squares indicate GPCRs known to be important regulators of insulin secretion; filled triangles indicate GPCRs with ligands that have been implicated in regulating insulin secretion without identification of the precise receptor or the physiologic importance; filled squares indicate orphan receptors; open circles indicate GPCRs with known ligands not previously implicated in the regulation of islet function. These data represent the average of 5 independent experiments.
Figure 5
Figure 5. Administration of T1AM causes Adra2a- and Gi-dependent hyperglycemia and hypoinsulinemia.
(A) Blood glucose levels following administration of T1AM (50 mg/kg, i.p.) or vehicle. T1AM induced hyperglycemia in wild-type (n = 6–7; *P < 0.01, **P < 0.001) but not in RIP-PTX mice. (B) Blood insulin levels 2 hours following vehicle or T1AM injection as in A relative to preinjection levels. Note the 60% decrease in insulin levels after T1AM in wild-type (n = 6; #P < 0.005) but not RIP-PTX mice. (C and D) The effects of T1AM on GSIS in isolated islets from mice (C) and humans (D). T1AM (10 μM) was capable of inhibiting GSIS in a PTX-sensitive manner in both species (PTX pretreatment 50 ng/ml for 16 hours). Data are presented as relative insulin secreted/total insulin (mean ± SEM; n = 3–4; ##P < 0.05). (E) Chemical similarity of T1AM and catecholamines. (F) Competition of T1AM and epinephrine for [3H]RX821002 binding to membranes from Cos cells transfected with an expression vector for human or mouse Adra2a. Binding of [3H]RX821002 was Adra2a transfection dependent. (G) Blood glucose levels 1 hour following T1AM administration to control mice and Adra2a-null mice. Note that control mice became hyperglycemic following T1AM administration (n = 9; ΧP = 0.001), but Adra2a-null mice became hypoglycemic (n = 11–12; ΧΧP = 0.003).
Figure 6
Figure 6. Par2 inhibits insulin release in vitro and in vivo.
(A) Insulin levels in conditioned medium from β cell–like MIN6 cells. Cells were incubated in low (3 mM) or high (15 mM) glucose in the presence or absence of the Par2 agonist SLIGRL. SLIGRL (100 μM) inhibited GSIS (n = 4; **P = 0.0055, control versus 100 μM), and this was prevented by pretreatment with pertussis toxin (50 ng/ml for 16 hours). (B) Plasma insulin levels were measured at time 0 and again at 3 minutes following administration of vehicle or SLIGRL (10 μmol/kg, i.p.). Note the larger SLIGRL-induced decrease in plasma insulin levels in control relative to Par2–/– mice (n = 12; *P = 0.012). (C) Par2–/– and littermate control mice were fasted for 2 hours then dosed with SLIGRL (10 μmol/kg, i.p.); blood glucose levels were measured at the indicated times after SLIGRL administration. Data are expressed relative to glucose levels at time 0 for each genotype (123 ± 10 mg/dl, control; 118 ± 13 mg/dl, Par2–/–). Littermate control mice became hyperglycemic relative to Par2–/– mice (n = 12–13; **P < 0.01). (D) RIP-PTX and littermate control mice were treated as in C. Basal glucose levels were 124 ± 14 mg/dl in littermate control mice and 86 ± 13 mg/dl in RIP-PTX mice. RIP-PTX mice failed to show glucose elevations in response to SLIGRL (n = 7–9; **P < 0.001). (E) Blood glucose levels in Par2–/– and littermate controls after i.p. glucose administration (IPGTT). Increases in blood glucose levels were blunted in Par2–/– mice compared with controls (n = 29–35; P = 0.0006 for difference between genotypes, 2-way ANOVA; **P = 0.001, *P = 0.01, difference in glucose levels at individual time points, unpaired Student’s t test).

References

    1. Hopkins A.L., Groom C.R. The druggable genome. Nat. Rev. Drug Discov. 2002;1:727–730. - PubMed
    1. Civelli O. GPCR deorphanizations: the novel, the known and the unexpected transmitters. Trends Pharmacol. Sci. 2005;26:15–19. - PubMed
    1. Offermanns S., Mancino V., Revel J.P., Simon M.I. Vascular system defects and impaired cell chemokinesis as a result of Galpha13 deficiency. Science. 1997;275:533–536. - PubMed
    1. Offermanns S., Toombs C.F., Hu Y.H., Simon M.I. Defective platelet activation in G alpha(q)-deficient mice. Nature. 1997;389:183–186. - PubMed
    1. Rudolph U., et al. Ulcerative colitis and adenocarcinoma of the colon in G alpha i2-deficient mice. Nat. Genet. 1995;10:143–150. - PubMed

Publication types

MeSH terms