

Interaction between TCL1 and Epac1 in the activation of Akt kinases in plasma membranes and nuclei of 8-CPT-2-O-Me-cAMP-stimulated macrophages
- PMID: 17993260
- PMCID: PMC2259443
- DOI: 10.1016/j.cellsig.2007.10.008
Interaction between TCL1 and Epac1 in the activation of Akt kinases in plasma membranes and nuclei of 8-CPT-2-O-Me-cAMP-stimulated macrophages
Abstract
Epac1 is a cAMP-stimulated guanine exchange factor that activates Rap1. The protein product of the T cell leukemia 1 (TCL1) proto-oncogene binds to Akt enhancing its kinase activity. TCL1 and Epac promote cellular proliferation because of their activating effects on Akt. Employing macrophages, we have studied the mechanisms whereby these proteins function in the regulation of Akt kinase activity. Cells were treated with 8-CPT-2-O-Me-cAMP, a cAMP analog which acts selectively and specifically via Epac1. Epac1 co-immunoprecipitated with TCL1 in plasma membrane and nuclear fractions of 8-CPT-2-O-Me-cAMP-stimulated macrophages. Interaction of TCL1 and Epac1 was also observed in a [125I]GST-Epac1 pulldown assay. A two-threefold increase in Akt Thr-308 and Akt Ser-473 protein kinase activities and their phosphoprotein levels was observed in TCL1 immunoprecipitates of plasma membranes and nuclei of the treated cells. Elevated Akt Thr-308 protein kinase activity and its phosphoprotein levels were significantly reduced in TCL1 immunoprecipitates of plasma membranes of 8-CPT-2-O-Me-cAMP-treated cells where Epac1 gene expression was silenced. In contrast, Akt Ser-473 protein kinase activity and its phosphoprotein levels were reduced only in plasma membranes. Our studies suggest that a ternary complex of TCL1, Epac1, and Akt forms in activated macrophages both promoting Akt activation and regulating intracellular distribution of Akt.
Figures
 )or 8-CPT-2-O-Me-cAMP (
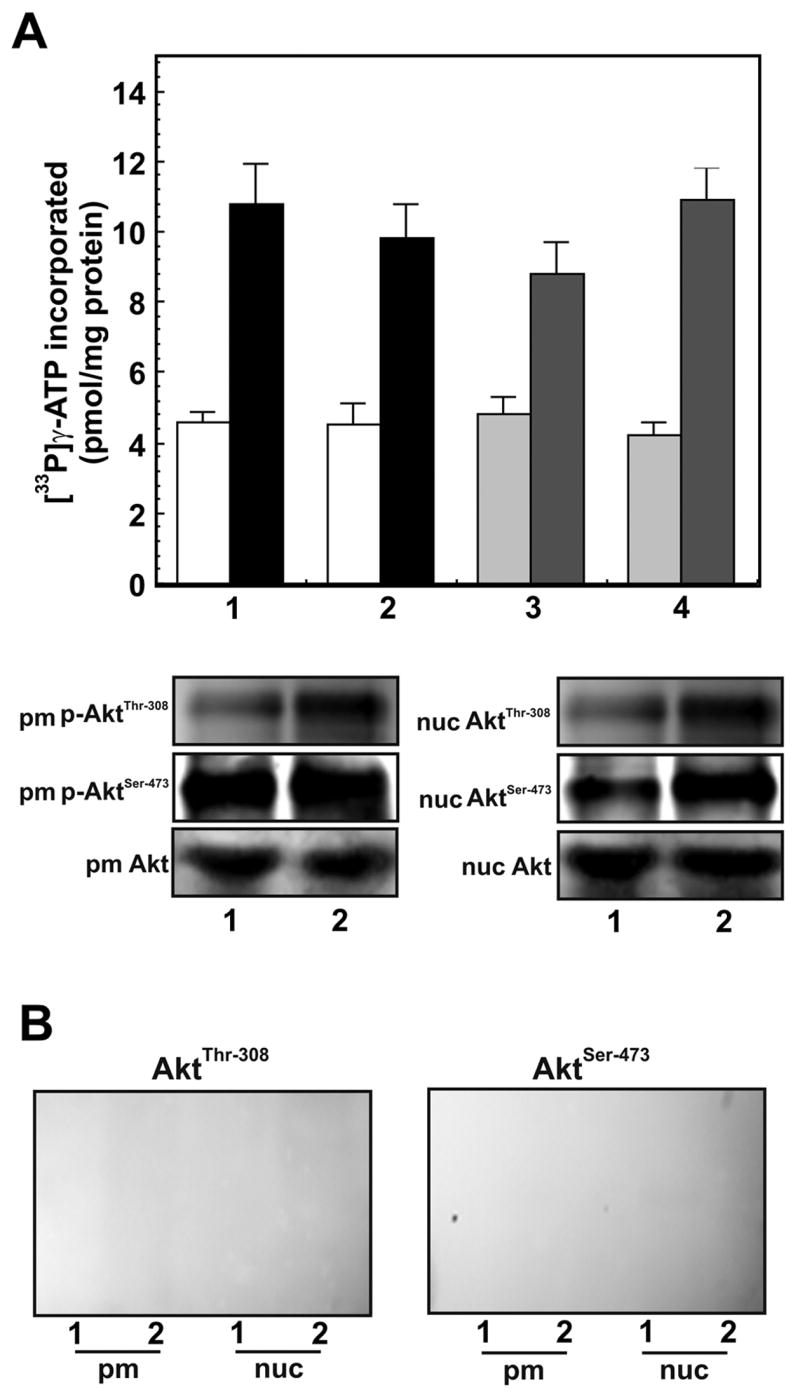
 ); and (4) AktSer-473 kinase activities in nuclei of cells treated with buffer (
) and 8-CPT-2-O-Me-cAMP (
). Akt1 kinase activities are expressed as [33P] γATP incorporated (pmol/mg protein) and are mean ± SE from three experiments. Immunoblots representative of three experiments of p-AktThr-308 and p-AktSer-473 of plasma membranes and nuclei are shown below the bar graph where (1) indicates buffer-treated and (2) 8-CPT-2-O-Me-cAMP-treated. Panel B. Specificity of antibodies employed in these studies. Immunoblots of non-immune IgG immunoprecipitates of plasma membrane and nuclear fractions of cells treated with: (1) buffer or (2) 8-CPT-2-O-Me-cAMP probed for p-AktThr-308 and p-AktSer-473.
); and (4) AktSer-473 kinase activities in nuclei of cells treated with buffer (
) and 8-CPT-2-O-Me-cAMP (
). Akt1 kinase activities are expressed as [33P] γATP incorporated (pmol/mg protein) and are mean ± SE from three experiments. Immunoblots representative of three experiments of p-AktThr-308 and p-AktSer-473 of plasma membranes and nuclei are shown below the bar graph where (1) indicates buffer-treated and (2) 8-CPT-2-O-Me-cAMP-treated. Panel B. Specificity of antibodies employed in these studies. Immunoblots of non-immune IgG immunoprecipitates of plasma membrane and nuclear fractions of cells treated with: (1) buffer or (2) 8-CPT-2-O-Me-cAMP probed for p-AktThr-308 and p-AktSer-473.
Similar articles
-
The cAMP-activated GTP exchange factor, Epac1 upregulates plasma membrane and nuclear Akt kinase activities in 8-CPT-2-O-Me-cAMP-stimulated macrophages: Gene silencing of the cAMP-activated GTP exchange Epac1 prevents 8-CPT-2-O-Me-cAMP activation of Akt activity in macrophages.Cell Signal. 2008 Aug;20(8):1459-70. doi: 10.1016/j.cellsig.2008.04.002. Epub 2008 Apr 15. Cell Signal. 2008. PMID: 18495429 Free PMC article.
-
Upregulation of mTORC2 activation by the selective agonist of EPAC, 8-CPT-2Me-cAMP, in prostate cancer cells: assembly of a multiprotein signaling complex.J Cell Biochem. 2012 May;113(5):1488-500. doi: 10.1002/jcb.24018. J Cell Biochem. 2012. Retraction in: J Cell Biochem. 2025 Jul;126(7):e70048. doi: 10.1002/jcb.70048. PMID: 22173835 Retracted.
-
Coordinate regulation of forskolin-induced cellular proliferation in macrophages by protein kinase A/cAMP-response element-binding protein (CREB) and Epac1-Rap1 signaling: effects of silencing CREB gene expression on Akt activation.J Biol Chem. 2005 Nov 18;280(46):38276-89. doi: 10.1074/jbc.M507332200. Epub 2005 Sep 19. J Biol Chem. 2005. PMID: 16172130
-
Epac-selective cAMP analogs: new tools with which to evaluate the signal transduction properties of cAMP-regulated guanine nucleotide exchange factors.Cell Signal. 2008 Jan;20(1):10-20. doi: 10.1016/j.cellsig.2007.07.009. Epub 2007 Jul 25. Cell Signal. 2008. PMID: 17716863 Free PMC article. Review.
-
Cell physiology of cAMP sensor Epac.J Physiol. 2006 Nov 15;577(Pt 1):5-15. doi: 10.1113/jphysiol.2006.119644. Epub 2006 Sep 14. J Physiol. 2006. PMID: 16973695 Free PMC article. Review.
Cited by
-
The cAMP-activated GTP exchange factor, Epac1 upregulates plasma membrane and nuclear Akt kinase activities in 8-CPT-2-O-Me-cAMP-stimulated macrophages: Gene silencing of the cAMP-activated GTP exchange Epac1 prevents 8-CPT-2-O-Me-cAMP activation of Akt activity in macrophages.Cell Signal. 2008 Aug;20(8):1459-70. doi: 10.1016/j.cellsig.2008.04.002. Epub 2008 Apr 15. Cell Signal. 2008. PMID: 18495429 Free PMC article.
-
EPAC and PKA allow cAMP dual control over DNA-PK nuclear translocation.Proc Natl Acad Sci U S A. 2008 Sep 2;105(35):12791-6. doi: 10.1073/pnas.0805167105. Epub 2008 Aug 26. Proc Natl Acad Sci U S A. 2008. PMID: 18728186 Free PMC article.
-
Intracellular cAMP Sensor EPAC: Physiology, Pathophysiology, and Therapeutics Development.Physiol Rev. 2018 Apr 1;98(2):919-1053. doi: 10.1152/physrev.00025.2017. Physiol Rev. 2018. PMID: 29537337 Free PMC article. Review.
-
Vascular mimicry: Triggers, molecular interactions and in vivo models.Adv Cancer Res. 2020;148:27-67. doi: 10.1016/bs.acr.2020.06.001. Epub 2020 Jul 16. Adv Cancer Res. 2020. PMID: 32723566 Free PMC article. Review.
-
Epac1-mediated, high glucose-induced renal proximal tubular cells hypertrophy via the Akt/p21 pathway.Am J Pathol. 2011 Oct;179(4):1706-18. doi: 10.1016/j.ajpath.2011.06.035. Epub 2011 Aug 18. Am J Pathol. 2011. PMID: 21854750 Free PMC article.
References
Publication types
MeSH terms
Substances
Grants and funding
LinkOut - more resources
Full Text Sources
Research Materials
