

Karhunen-Loève representation distinguishes ST-T wave morphology differences in emergency department chest pain patients with non-ST-elevation myocardial infarction versus nonacute coronary syndrome
- PMID: 17993312
- PMCID: PMC2128770
- DOI: 10.1016/j.jelectrocard.2007.05.029
Karhunen-Loève representation distinguishes ST-T wave morphology differences in emergency department chest pain patients with non-ST-elevation myocardial infarction versus nonacute coronary syndrome
Abstract
Patients presenting to the emergency department with chest pain are triaged to early reperfusion therapies based on their initial 12-lead electrocardiogram (ECG). The standard 12-lead ECG lacks sensitivity to detect acute myocardial infarction (AMI). Electrocardiographic diagnosis of non-ST-elevation myocardial infarction (non-STEMI) is especially difficult and is delayed until cardiac biomarkers turn positive, indicating onset of myocardial necrosis.
Study aims: The purpose of this analysis was to extract global ST-T waveform features from patients with chest pain, compare these features in patients with and without AMI, and then identify features that distinguish diagnostic categories.
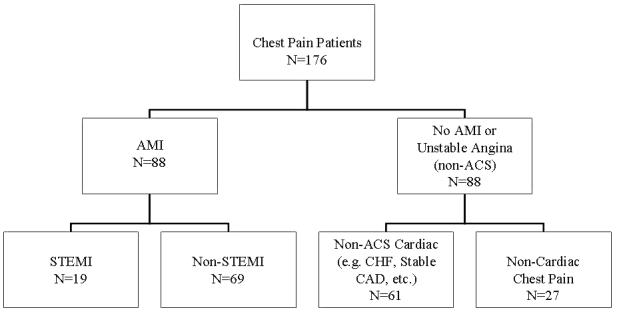
Methods: This is a secondary analysis of data from the Ischemia Monitoring and Mapping in the Emergency Department in Appropriate Triage and Evaluation of Acute Ischemic Myocardium study, a prospective clinical trial in which patients were attached to Holter monitor devices to obtain 24 hours of continuous ECG data. Digital recordings from 176 patients were analyzed: 88 with AMI (STEMI and non-STEMI) and 88 without AMI or unstable angina. The non-acute coronary syndrome (ACS) group was further subdivided into those with non-ACS cardiac conditions such as heart failure and those without cardiac disease who had noncardiac chest pain. For each patient, 10 consecutive waveforms were obtained within the first 120 minutes of emergency department presentation. The waveforms were time-aligned to the QRS, signal-averaged, baseline-adjusted. ST-T waveforms were complied according to diagnostic category and pooled for further analysis. Eigenvector-lead feature coefficients (Karhunen-Loève [K-L] coefficients) were obtained for each patient by taking the dot product of the ST-T wave (ST segment or entire waveform) and the first 3 common eigenvectors, producing 24 K-L coefficients. Cumulative probability distribution function curves were plotted for each diagnostic category. Statistical significance of category coefficient distribution differences was determined. Multinomial regression was used to assess accuracy of feature coefficients to predict diagnostic category.
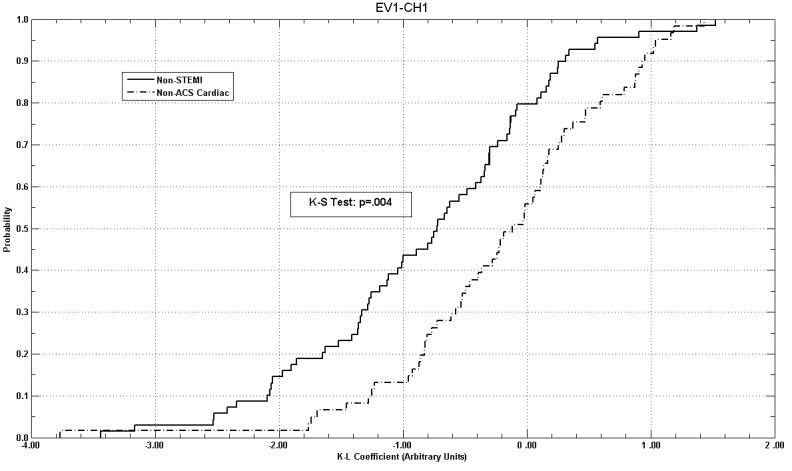
Results: Non-STEMI and non-ACS cardiac category K-L coefficient curves were statistically different in 11 of 24 feature curves (P < .001-.047). ST-segment (50 samples) coefficients predicted non-ACS cardiac patients 11.5% more often (P = .02) than those derived from the entire ST-T wave.
Conclusion: Patients diagnosed with non-STEMI have distinct distribution of K-L coefficients compared with non-ACS cardiac patients. Coefficients from the first 50 samples of the ST-T wave (ST segment) better predict diagnostic category than do coefficients derived from the entire ST-T wave. Karhunen-Loève coefficient feature analysis may provide early diagnostic information to distinguish patients with non-STEMI vs non-ACS cardiac patients.
Figures
Similar articles
-
Assessing sensitivity and specificity of the Manchester Triage System in the evaluation of acute coronary syndrome in adult patients in emergency care: a systematic review protocol.JBI Database System Rev Implement Rep. 2015 Nov;13(11):64-73. doi: 10.11124/jbisrir-2015-2213. JBI Database System Rev Implement Rep. 2015. PMID: 26657465
-
Emergency medical service predictive instrument-aided diagnosis and treatment of acute coronary syndromes and ST-segment elevation myocardial infarction in the IMMEDIATE trial.Prehosp Emerg Care. 2011 Apr-Jun;15(2):139-48. doi: 10.3109/10903127.2010.545478. Prehosp Emerg Care. 2011. PMID: 21366431 Free PMC article.
-
Fast assessment and management of chest pain without ST-elevation in the pre-hospital gateway: rationale and design.Eur Heart J Acute Cardiovasc Care. 2015 Apr;4(2):129-36. doi: 10.1177/2048872614549738. Epub 2014 Sep 8. Eur Heart J Acute Cardiovasc Care. 2015. PMID: 25202026 Clinical Trial.
-
Electrocardiographic classification of acute coronary syndromes: a review by a committee of the International Society for Holter and Non-Invasive Electrocardiology.J Electrocardiol. 2010 Mar-Apr;43(2):91-103. doi: 10.1016/j.jelectrocard.2009.07.009. Epub 2009 Nov 14. J Electrocardiol. 2010. PMID: 19913800 Review.
-
Context-independent identification of myocardial ischemia in the prehospital ECG of chest pain patients.J Electrocardiol. 2024 Jan-Feb;82:34-41. doi: 10.1016/j.jelectrocard.2023.10.009. Epub 2023 Nov 7. J Electrocardiol. 2024. PMID: 38006762 Review.
Cited by
-
Comparison of Support-Vector Machine and Sparse Representation Using a Modified Rule-Based Method for Automated Myocardial Ischemia Detection.Comput Math Methods Med. 2016;2016:9460375. doi: 10.1155/2016/9460375. Epub 2016 Jan 26. Comput Math Methods Med. 2016. PMID: 26925158 Free PMC article.
-
The new universal definition of myocardial infarction criteria improve electrocardiographic diagnosis of acute coronary syndrome.J Electrocardiol. 2011 Jan-Feb;44(1):69-73. doi: 10.1016/j.jelectrocard.2010.10.037. J Electrocardiol. 2011. PMID: 21168005 Free PMC article.
-
Changes in dipolar structure of cardiac magnetic field maps after ST elevation myocardial infarction.Ann Noninvasive Electrocardiol. 2011 Oct;16(4):379-87. doi: 10.1111/j.1542-474X.2011.00466.x. Ann Noninvasive Electrocardiol. 2011. PMID: 22008494 Free PMC article.
-
ECG-derived Cheyne-Stokes respiration and periodic breathing in healthy and hospitalized populations.Ann Noninvasive Electrocardiol. 2017 Nov;22(6):e12462. doi: 10.1111/anec.12462. Epub 2017 Jun 15. Ann Noninvasive Electrocardiol. 2017. PMID: 28618169 Free PMC article.
References
-
- Laguna P, Moody GB, Garcia J, Goldberger AL, Mark RG. Analysis of the ST-T complex of the electrocardiogram using the Karhunen--Loeve transform: adaptive monitoring and alternans detection. Med Biol Eng Comput. 1999;37:175–89. - PubMed
-
- Lux RL, Evans AK, Burgess MJ, Wyatt RF, Abildskov JA. Redundancy reduction for improved display and analysis of body surface potential maps. I. Spatial compression. Circ Res. 1981;49:186–96. - PubMed
-
- Mason RE, Likar I. A new system of multiple-lead exercise electrocardiography. Am Heart J. 1966;71:196–205. - PubMed
-
- Meyer CR, Keiser HN. Electrocardiogram baseline noise estimation and removal using cubic splines and state-space computation techniques. Comput Biomed Res. 1977;10:459–70. - PubMed
-
- Lux RL. Principal components analysis: an old but powerful tool for ECG analsysis. International Journal of Bioelectromagnetism. 2003;5:342–345.
Publication types
MeSH terms
Grants and funding
LinkOut - more resources
Full Text Sources
Medical
