

Dynamic tracking of ischemia in the surface electrocardiogram
- PMID: 17993319
- PMCID: PMC2121619
- DOI: 10.1016/j.jelectrocard.2007.06.015
Dynamic tracking of ischemia in the surface electrocardiogram
Abstract
Background: Accurate detection of the earliest signs of ischemia on the surface electrocardiogram (ECG) is essential for timely diagnosis and management of potentially life-threatening ischemic events. Yet, accuracy of ischemia analysis in ECG monitors remains suboptimal because of a number of confounding factors, including changes in body position and other artifacts. Hence, the goals of this study were (1) to examine the duration and time course of ischemic events and (2) to compare ECG changes caused by "true" ischemic events with those caused by changes in body position. Continuous, 12-lead Holter ECGs obtained from patients who presented to the emergency department with chest pain and enrolled in the Ischemia Monitoring and Mapping in the Emergency Department in Appropriate Triage and Evaluation of Acute Ischemic Myocardium study were analyzed. Holter recordings were initiated within the first 40 minutes after patients' arrival to the emergency department. Here we present preliminary results.
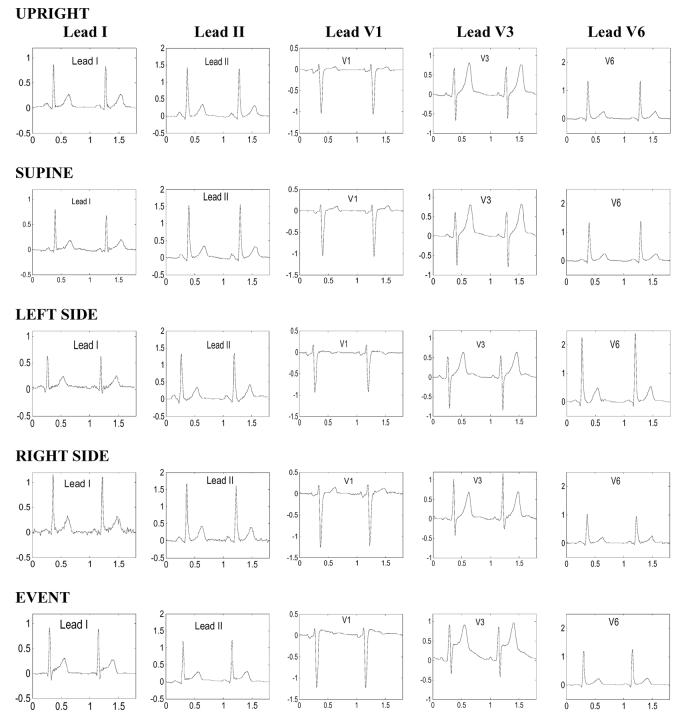
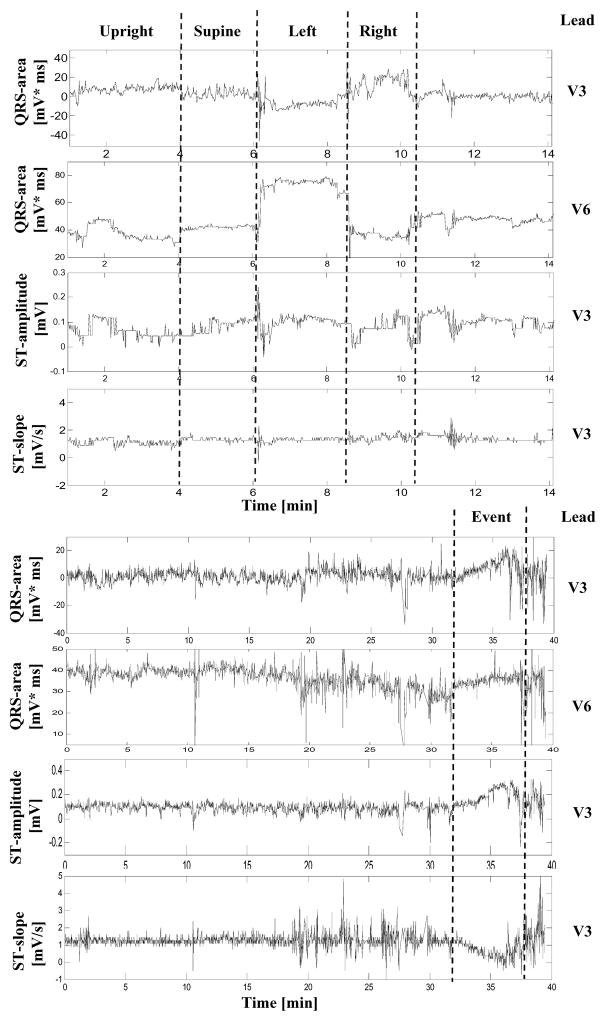
Methods: Twelve patients (age, 59 +/- 16 years; 5 women, 2 with a final diagnosis of non-ST-segment elevation myocardial infarction, 4 with unstable angina, and 6 with other cardiovascular diseases), in whom ischemic ST deviations were identified on Holter data, underwent 4 consecutive, 2-minute recordings in the following body positions: (1) supine, (2) on the left side, (3) on the right side, and (4) sitting (or standing) upright. After baseline correction, beat-to-beat changes in QRS and ST-T segments were examined in all 8 channels and the root-mean-square curve by using an adaptive algorithm that computes the slope, amplitude, duration, area, and the Karhunen-Loève-derived representation of the corresponding segment. To prevent possible biases toward patients with more frequent ischemic events, a single index event was chosen for analysis in each patient. There were 3 ST-elevation events and 9 ST-depression events; these events reached the maximum ST deviation 11 +/- 8 hours (mean +/- SD) after the beginning of the recording.
Results and conclusions: In most patients with transient myocardial ischemia, the microvolt-level, subthreshold deviation of the ST segment developed gradually, over 15 to 20 minutes, until it reached the maximum, superthreshold level. Despite the different ischemia localizations, the root-mean-square curve allowed accurate detection of significant changes in the ST segment in the studied group (Friedman analysis of variance for repeated measurements over a 1-hour interval). Changes in body position could be identified by tracking dynamics of the QRS pattern/axis. Adaptive algorithms for tracking of the ST dynamics with simultaneous tracking of the patterns of QRS complexes to discriminate the true and "false"-positive events are presented and discussed.
Figures

References
-
- Crawford M, Bernstein S, Deedwania P, et al. ACC/AHA Guidelines for ambulatory electrocardiography. J Am Coll Cardiol. 1999;34:912. - PubMed
-
- Norgaard BL, Rasmussen BM, Dellborg M, et al. Temporal and positional variability of the ST segment during continuous vectorcardiography monitoring in healthy subjects. J Electrocardiol. 1999;32:149. - PubMed
-
- Adams MG, Drew BJ. Efficacy of 2 Strategies to Detect Body Position ST-Segment Changes during Continuous 12-Lead Electrocardiographic Monitoring. Journal of Electrocardiology. 2002;35(Suppl):193. - PubMed
-
- Drew BJ, Adams MG. Clinical consequences of ST-segment changes caused by body position mimicking transient myocardial ischemia: hazards of ST-segment monitoring? J Electrocardiol. 2001 Jul;34(3):261. - PubMed
-
- García J, Åström M, Mendive J, Laguna P, Sörnmo L. ECG-Based Detection of Body Position Changes in Ischemia Monitoring IEEE Transactions on Biomedical Engineering. 2003;50:677. - PubMed
Publication types
MeSH terms
Grants and funding
LinkOut - more resources
Full Text Sources
Medical
