

Photon scattering effects in optical mapping of propagation and arrhythmogenesis in the heart
- PMID: 17993334
- PMCID: PMC2121611
- DOI: 10.1016/j.jelectrocard.2007.06.020
Photon scattering effects in optical mapping of propagation and arrhythmogenesis in the heart
Abstract
Background: Optical mapping is a widely used experimental tool providing high-resolution recordings of cardiac electrical activity. However, the technique is limited by signal distortion due to photon scattering in the tissue. Computational models of the fluorescence recording are capable of assessing these distortion effects, providing important insight to assist experimental data interpretation.
Methods: We present results from a new panoramic optical mapping model, which is used to assess distortion in ventricular optical mapping signals during pacing and arrhythmogenesis arising from 3-dimensional photon scattering.
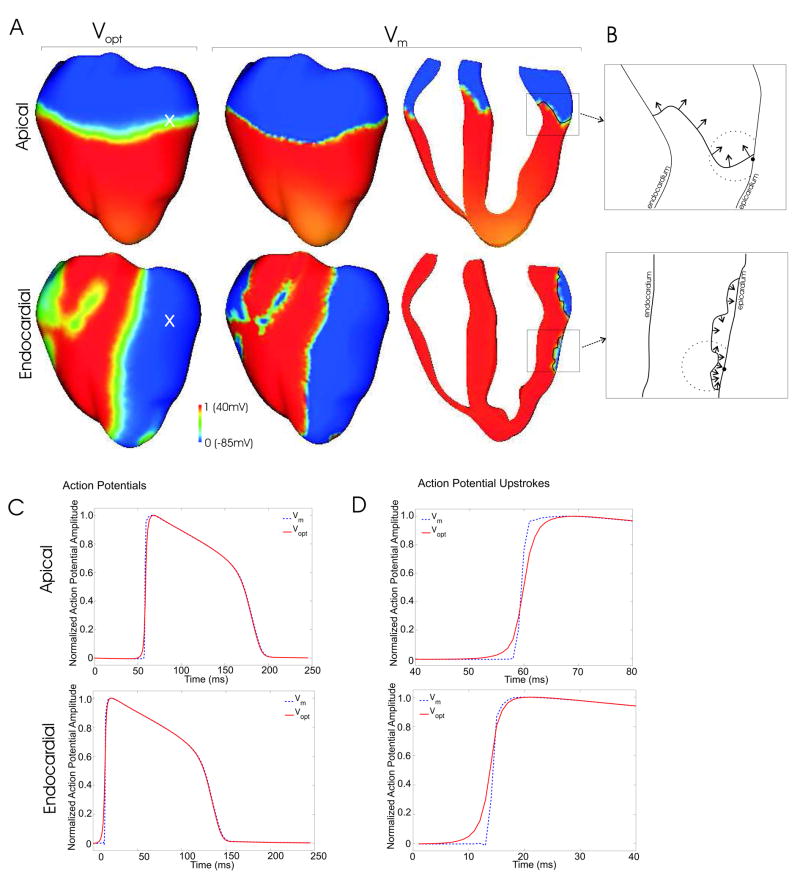
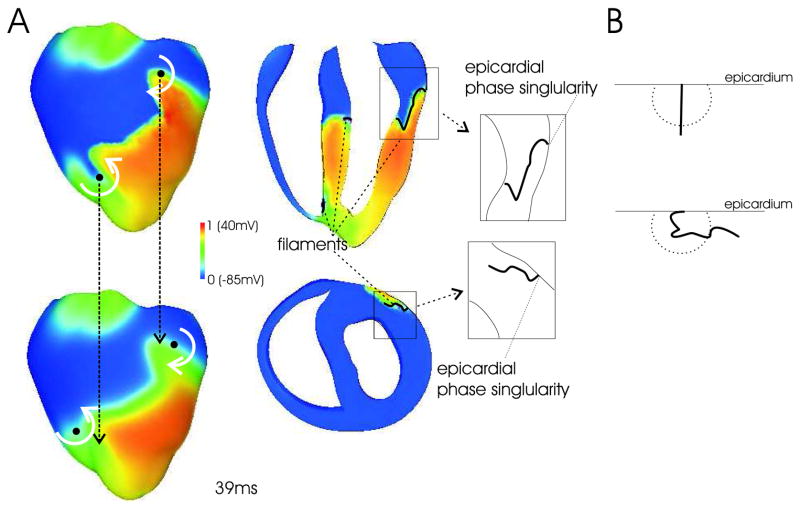
Results/conclusions: We demonstrate that accurate consideration of wavefront propagation within the complex ventricular structure, along with accurate representation of photon scattering in 3 dimensions, is essential to faithfully assess distortion effects arising during optical mapping. In this article, examined effects include (1) the specific morphology of the optical action potential upstroke during pacing and (2) the shift in the location of epicardial phase singularities obtained from fluorescent maps.
Figures
Similar articles
-
Three-dimensional panoramic imaging of cardiac arrhythmias in rabbit heart.J Biomed Opt. 2007 Jul-Aug;12(4):044019. doi: 10.1117/1.2753748. J Biomed Opt. 2007. PMID: 17867823
-
Modulation of shock-end virtual electrode polarisation as a direct result of 3D fluorescent photon scattering.Conf Proc IEEE Eng Med Biol Soc. 2006;2006:1556-9. doi: 10.1109/IEMBS.2006.259243. Conf Proc IEEE Eng Med Biol Soc. 2006. PMID: 17946049
-
Construction of 3D MR image-based computer models of pathologic hearts, augmented with histology and optical fluorescence imaging to characterize action potential propagation.Med Image Anal. 2012 Feb;16(2):505-23. doi: 10.1016/j.media.2011.11.007. Epub 2011 Dec 6. Med Image Anal. 2012. PMID: 22209561
-
Towards Depth-Resolved Optical Imaging of Cardiac Electrical Activity.Adv Exp Med Biol. 2015;859:405-23. doi: 10.1007/978-3-319-17641-3_16. Adv Exp Med Biol. 2015. PMID: 26238062 Review.
-
Optical imaging of arrhythmias in tissue culture.J Electrocardiol. 2006 Oct;39(4 Suppl):S2-6. doi: 10.1016/j.jelectrocard.2006.04.010. J Electrocardiol. 2006. PMID: 17015066 Review.
Cited by
-
A comprehensive framework for evaluation of high pacing frequency and arrhythmic optical mapping signals.Front Physiol. 2023 Jan 23;14:734356. doi: 10.3389/fphys.2023.734356. eCollection 2023. Front Physiol. 2023. PMID: 36755791 Free PMC article.
-
Polarity reversal lowers activation time during diastolic field stimulation of the rabbit ventricles: insights into mechanisms.Am J Physiol Heart Circ Physiol. 2008 Oct;295(4):H1626-33. doi: 10.1152/ajpheart.00706.2008. Epub 2008 Aug 15. Am J Physiol Heart Circ Physiol. 2008. PMID: 18708441 Free PMC article.
-
High resolution optical mapping of cardiac electrophysiology in pre-clinical models.Sci Data. 2022 Mar 31;9(1):135. doi: 10.1038/s41597-022-01253-1. Sci Data. 2022. PMID: 35361792 Free PMC article.
-
Tissue-Specific Optical Mapping Models of Swine Atria Informed by Optical Coherence Tomography.Biophys J. 2018 Mar 27;114(6):1477-1489. doi: 10.1016/j.bpj.2018.01.035. Biophys J. 2018. PMID: 29590604 Free PMC article.
-
Origin of complex behaviour of spatially discordant alternans in a transgenic rabbit model of type 2 long QT syndrome.J Physiol. 2009 Oct 1;587(Pt 19):4661-80. doi: 10.1113/jphysiol.2009.175018. Epub 2009 Aug 12. J Physiol. 2009. PMID: 19675070 Free PMC article.
References
-
- Girouard SD, Laurita KR, Rosenbaum DS. Unique properties of cardiac action potentials with voltage-sensitive dyes. J Cardiovasc Electrophysiol. 1996;7(11):1024–1038. - PubMed
-
- Efimov IR, Aguel F, Cheng Y, Wollebzier B, Trayanova NA. Virtual electrode polarization in the far field: implications for external defibrilation. Am J Physiol Heart Circ Physiol. 2000;279:H1055–H1070. - PubMed
-
- Efimov IR, Sidorov V, Cheng Y, Wollenzier B. Evidence of three-dimensional scroll waves with ribbon-shaped filaments as a mechanism of ventricular tachycardia in isolated rabbit heart. J Cardiovasc Electrophysiol. 1999;10:1451–1462. - PubMed
Publication types
MeSH terms
Grants and funding
LinkOut - more resources
Full Text Sources
Medical
