. 2008 Apr 1;94(7):2654-66.
doi: 10.1529/biophysj.107.118596. Epub 2007 Nov 9.

Raft composition at physiological temperature and pH in the absence of detergents

Affiliations

Raft composition at physiological temperature and pH in the absence of detergents

Artem G Ayuyan et al. Biophys J. .

Abstract

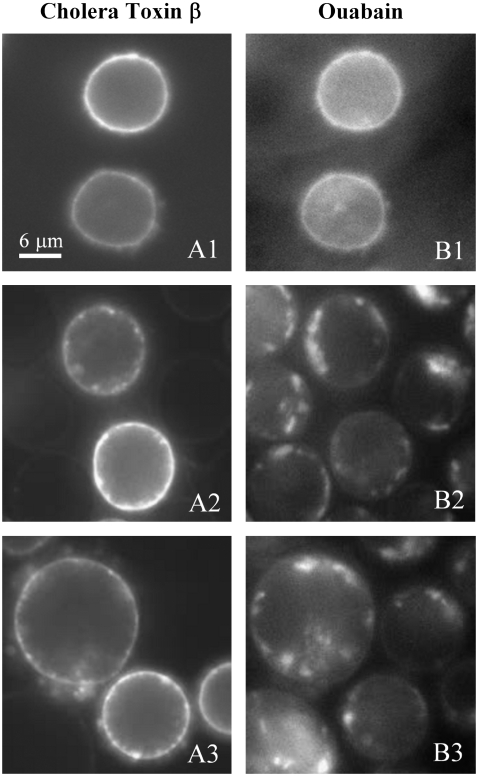
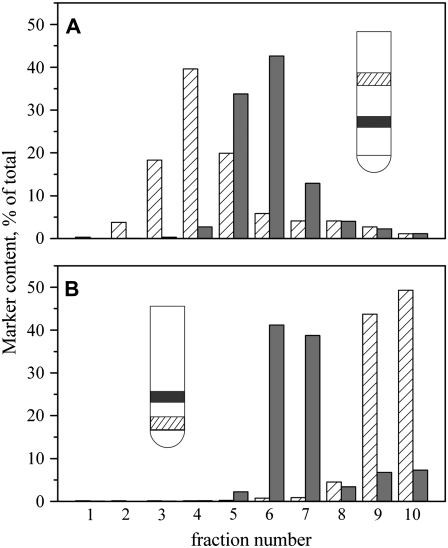
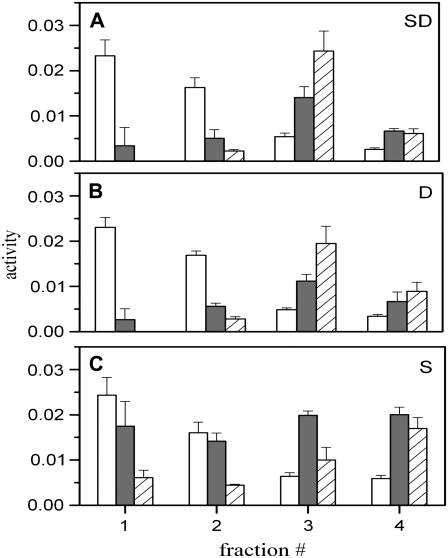
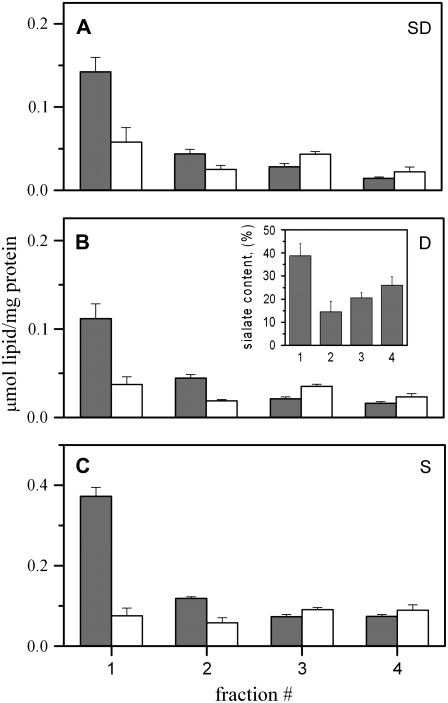
Biological rafts were identified and isolated at 37 degrees C and neutral pH. The strategy for isolating rafts utilized membrane tension to generate large domains. For lipid compositions that led only to microscropically unresolvable rafts in lipid bilayers, membrane tension led to the appearance of large, observable rafts. The large rafts converted back to small ones when tension was relieved. Thus, tension reversibly controls raft enlargement. For cells, application of membrane tension resulted in several types of large domains; one class of the domains was identified as rafts. Tension was generated in several ways, and all yielded raft fractions that had essentially the same composition, validating the principle of tension as a means to merge small rafts into large rafts. It was demonstrated that sphingomyelin-rich vesicles do not rise during centrifugation in sucrose gradients because they resist lysis, necessitating that, contrary to current experimental practice, membrane material be placed toward the top of a gradient for raft fractionation. Isolated raft fractions were enriched in a GPI-linked protein, alkaline phosphatase, and were poor in Na(+)-K(+) ATPase. Sphingomyelin and gangliosides were concentrated in rafts, the expected lipid raft composition. Cholesterol, however, was distributed equally between raft and nonraft fractions, contrary to the conventional view.


Figures

FIGURE 1
FIGURE 1
Tension promotes large rafts in GUVs. GUVs in suspension composed of eSM/cholesterol/DOPC 1/2/2 and containing 1% Rho-DOPE and 3% NBD-DPPE as probes exhibited uniform fluorescence in isotonic 200 mM sucrose (not shown). When these GUVs were added to an external solution of 180 mM glucose, they settled, and the progression of raft formation was followed over time in the largest of the GUVs in the field of view. Times after addition of GUVs to the hypoosmotic solution are shown in seconds in each panel. Smaller rafts consolidate into larger rafts on the surface of the GUV over time. Fluorescence is shown for NBD-DPPE.
FIGURE 2
FIGURE 2
Fluorimetric detection of formation of rafts on lowering of the temperature. Temperature was lowered from 58°C to 20°C, and the fluorescence of SUVs containing 0.1% NBD-DPPE was followed; 5% Rho-DOPE was included in the SUVs to quench NBD fluorescence. The fluorescence of SUVs composed of (in addition to the probes) either 20% 16:0 SM, 40% cholesterol, 34.9% DOPC (triangles) or 20% eSM, 40% cholesterol, 34.9% DOPC (circles) increased at 40–45°C, and the increase continued as temperature was lowered further. The increase in fluorescence indicates phase separation. The fluorescence of SUVs composed of 40% cholesterol and 54.9% DOPC never increased as temperature was lowered (squares). An absence of an error bar means that the bar is smaller that the size of the symbol. Error bars are SE, n = 3.
FIGURE 3
FIGURE 3
Large raft formation is reversible. Conditions were as in Fig. 1. Large rafts had already formed at the start of observing GUVs after they were placed in the hypotonic external solution. The sharp boundaries blurred in frames between 34 and 35 s. At 56 s, sharp boundaries once again formed. At 78 s, edges of rafts have blurred and remained blurred beyond 96 s, and eventually sharpened again (steady-state, not shown). NBD-DPPE was included in the GUVs to mark rafts as bright domains.
FIGURE 4
FIGURE 4
(A) Blurring of raft boundaries occurs simultaneously with liposome shrinkage. The GUV of Fig. 3 is shown at 34 and 35 s. Raft boundaries are distinct at 34 s but diffuse at 35 s. The GUV diameter is slightly but discernibly less at 35 s than at 34 s, a difference of ∼1 μm. The most plausible explanation is that GUV rupture (i.e., formation of a lipid pore) occurred at this point; the collapse of tension caused the large rafts to break up into many small rafts, although the diffusion of all of them is observable only at the blurred boundary. (B) The diameter of the GUV (0.2 μm/pixel) is shown as a function of frame number (1 s/frame). The moments of edge blurring are marked by bold, vertical arrows. Shrinkage is observed as a sudden descrease of several pixels in GUV diameter. Reswelling is observed as stepwise increases in diameter. The momentary (one or two frames) fluctuations of one pixel in height result from the limitation of optical resolution, which corresponds to one pixel. The overall pattern of shrinkage and swelling is as expected: GUV shrinkage occurred rapidly (within one frame) and correlated in time with edge blurring (arrows). The increase in GUV diameter was slow, consistent with the time for water to enter a giant liposome. For this GUV, shrinkage occurred twice, each time followed by swelling. Each of the two blurrings (arrows) occurred at the instant of shrinkage.
FIGURE 5
FIGURE 5
Swelling induces large rafts in cells at 37°C. Fluorescently labeled β-subunit of cholera toxin was used to bind GM1 to mark rafts (A1, A2, and A3), and fluorescently labeled ouabain was used to bind Na+-K+ ATPase (B1, B2, and B3) to identify nonraft domains. Both probes distribute uniformly across nonswollen cells (A1 and B1). A1 and B1 are the same cells shown for the two probes. Panels 2 and 3 are different cells than panel 1, but are paired A and B. Panels 2 and 3 show cells ∼30 min after swelling. Both probes have clustered into large domains of different sizes that do not overlap with each other.
FIGURE 6
FIGURE 6
(A) High SM content retards liposome flotation in sucrose gradients. DOPC/cholesterol liposomes 100 nm in diameter labeled by Rho-DOPE and SM/cholesterol liposomes labeled with NBD-DPPE were placed at the bottom of a sucrose gradient and allowed to come to their equilibrium positions by high-speed centrifugation. Results of a typical experiment are shown. (A) The SM-rich liposomes (solid bars) were distributed to higher densities (lower in the illustrated centrifuge tube and higher fraction number in the histogram) than the DOPC-rich liposomes (striped bars in illustrated test tube and histogram). (B) Triton X-100-treated SM/cholesterol liposomes. SM/cholesterol liposomes treated with 0.5% Triton X-100 at 4°C. In flotation experiments, preparations that were not treated with Triton (A) were concentrated at the same interface as those that were treated (B), as illustrated by the same position of the solid bar within the test tubes of panels A and B. In collecting 1-ml fractions, the relative NBD-DOPE contents (solid bars) were within one fraction of each other in panels A and B, showing that the distribution was not affected by Triton X-100. The material of DOPC/cholesterol liposomes (striped bars) remained at the position they were placed, showing that these liposomes were completely dissolved by 0.5% Triton X-100: dissolved material does not migrate during centrifugation.
FIGURE 7
FIGURE 7
Segregation of raft and nonraft proteins. The activity of alkaline phosphatase (open bars), alkaline diesterase (solid bars), and Na+-K+ ATPase (striped bars) in separated fractions were measured after various means of generating tension in cells. (A) Cells were swollen and then dounced (SD). (B) Cells were only dounced (D). (C) Cells were swollen and membrane domains gently sheared off (S). All activities are shown in arbitrary units.
FIGURE 8
FIGURE 8
SM and cholesterol content of isolated membrane fractions. A, B, and C are the SM and cholesterol content of each fraction of Fig. 7, normalized to its protein content. Although the normalized cholesterol concentration was the same for all fractions, we cannot unambiguously conclude that the cholesterol concentration is the same in all the fractions because protein levels are different in the various fractions. However, because both SM and cholesterol are both normalized to protein, we can be certain that SM is highly enriched in the lightest fraction relative to cholesterol. The inset in B shows the percentage of the total sialate content within each of the four fractions.

Similar articles

Cited by

References

    1. Hess, S. T., M. Kumar, A. Verma, J. Farrington, A. Kenworthy, and J. Zimmerberg. 2005. Quantitative electron microscopy and fluorescence spectroscopy of the membrane distribution of influenza hemagglutinin. J. Cell Biol. 169:965–976. - PMC - PubMed
    1. Pike, L. J. 2006. Rafts defined: a report on the Keystone Symposium on Lipid Rafts and Cell Function. J. Lipid Res. 47:1597–1598. - PubMed
    1. Pralle, A., P. Keller, E. L. Florin, K. Simons, and J. K. Horber. 2000. Sphingolipid-cholesterol rafts diffuse as small entities in the plasma membrane of mammalian cells. J. Cell Biol. 148:997–1008. - PMC - PubMed
    1. Jacobson, K., O. G. Mouritsen, and R. G. Anderson. 2007. Lipid rafts: at a crossroad between cell biology and physics. Nat. Cell Biol. 9:7–14. - PubMed
    1. Hancock, J. F. 2006. Lipid rafts: contentious only from simplistic standpoints. Nat. Rev. Mol. Cell Biol. 7:456–462. - PMC - PubMed

Publication types