

Mechanical and failure properties of extracellular matrix sheets as a function of structural protein composition
- PMID: 17993498
- PMCID: PMC2242735
- DOI: 10.1529/biophysj.107.107144
Mechanical and failure properties of extracellular matrix sheets as a function of structural protein composition
Abstract
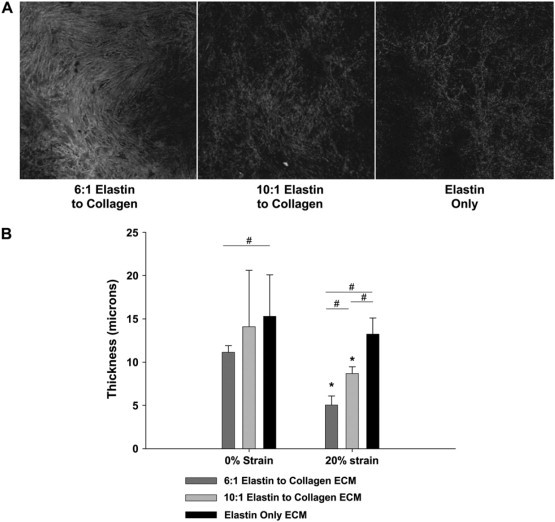
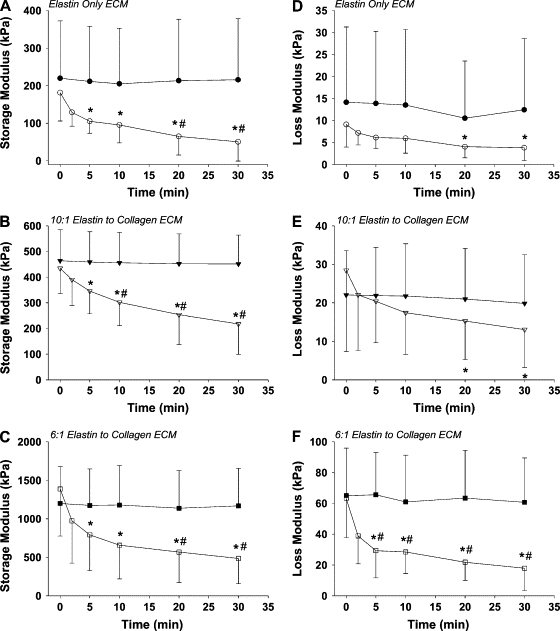
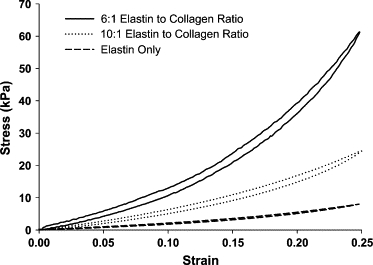
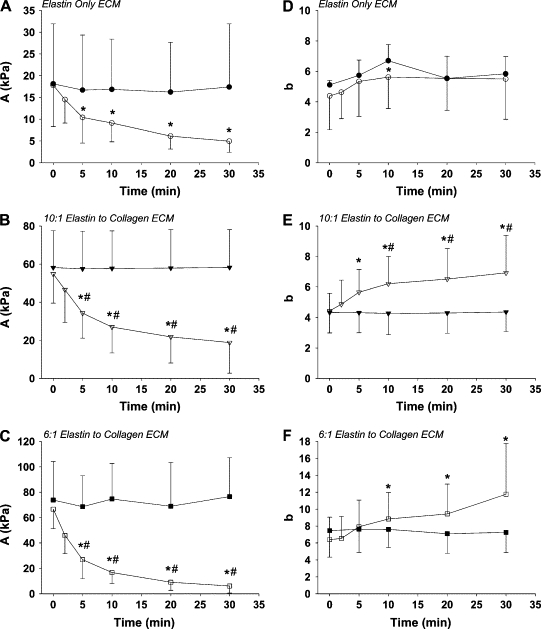
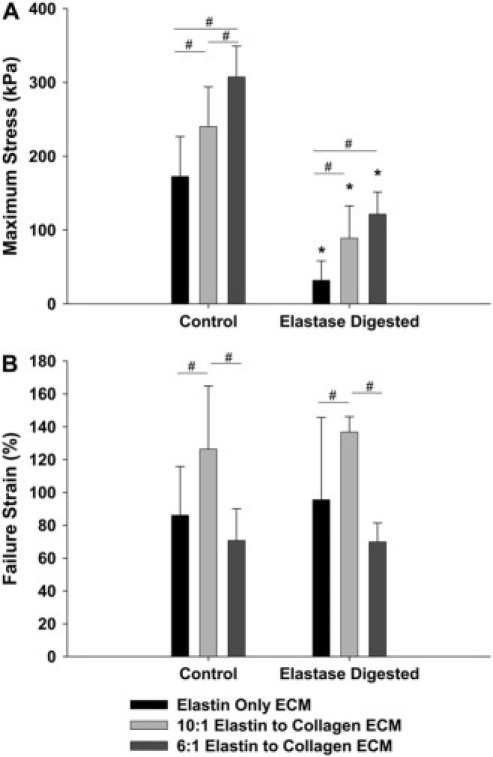
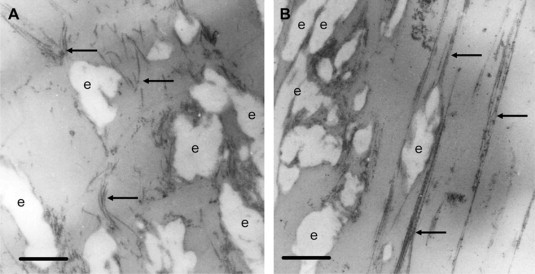
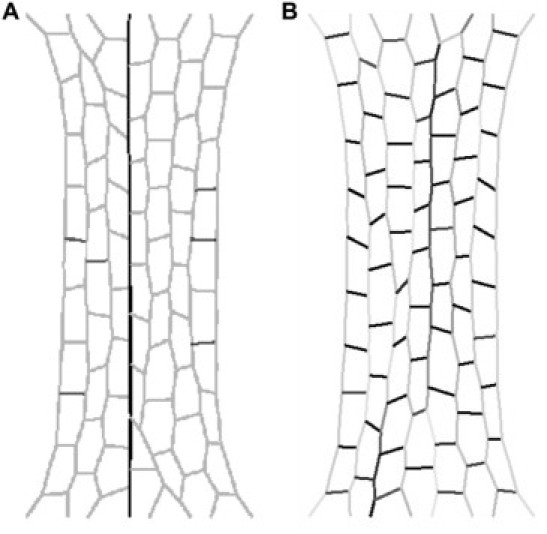
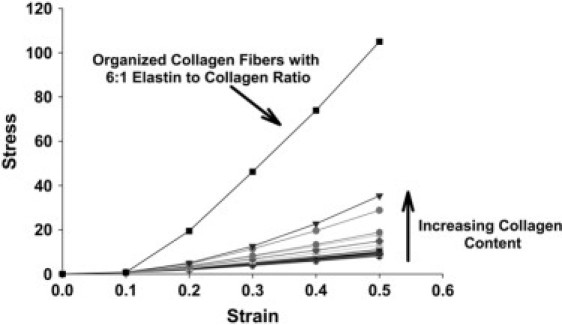
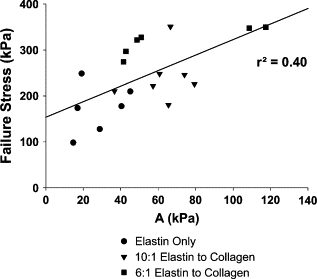
The goal of this study was to determine how alterations in protein composition of the extracellular matrix (ECM) affect its functional properties. To achieve this, we investigated the changes in the mechanical and failure properties of ECM sheets generated by neonatal rat aortic smooth muscle cells engineered to contain varying amounts of collagen and elastin. Samples underwent static and dynamic mechanical measurements before, during, and after 30 min of elastase digestion followed by a failure test. Microscopic imaging was used to measure thickness at two strain levels to estimate the true stress and moduli in the ECM sheets. We found that adding collagen to the ECM increased the stiffness. However, further increasing collagen content altered matrix organization with a subsequent decrease in the failure strain. We also introduced collagen-related percolation in a nonlinear elastic network model to interpret these results. Additionally, linear elastic moduli correlated with failure stress which may allow the in vivo estimation of the stress tolerance of ECM. We conclude that, in engineered replacement tissues, there is a tradeoff between improved mechanical properties and decreased extensibility, which can impact their effectiveness and how well they match the mechanical properties of native tissue.
Figures
Similar articles
-
Differential effects of static and cyclic stretching during elastase digestion on the mechanical properties of extracellular matrices.J Appl Physiol (1985). 2007 Sep;103(3):803-11. doi: 10.1152/japplphysiol.00057.2007. Epub 2007 May 31. J Appl Physiol (1985). 2007. PMID: 17540839
-
Effects of elastase on the mechanical and failure properties of engineered elastin-rich matrices.J Appl Physiol (1985). 2005 Apr;98(4):1434-41. doi: 10.1152/japplphysiol.00921.2004. Epub 2005 Jan 7. J Appl Physiol (1985). 2005. PMID: 15640390
-
Contributions of collagen and elastin to elastic behaviours of tendon fascicle.Acta Biomater. 2024 Mar 1;176:334-343. doi: 10.1016/j.actbio.2024.01.014. Epub 2024 Jan 17. Acta Biomater. 2024. PMID: 38237712
-
Alterations in connective tissue metabolism in stress incontinence and prolapse.J Urol. 2011 Nov;186(5):1768-72. doi: 10.1016/j.juro.2011.06.054. Epub 2011 Sep 25. J Urol. 2011. PMID: 21944102 Review.
-
A Comparison of the Mechanical Properties of ECM Components and Synthetic Self-Assembling Peptides.Adv Healthc Mater. 2025 Apr;14(11):e2402385. doi: 10.1002/adhm.202402385. Epub 2025 Feb 19. Adv Healthc Mater. 2025. PMID: 39972630 Free PMC article. Review.
Cited by
-
The ECM: To Scaffold, or Not to Scaffold, That Is the Question.Int J Mol Sci. 2021 Nov 24;22(23):12690. doi: 10.3390/ijms222312690. Int J Mol Sci. 2021. PMID: 34884495 Free PMC article. Review.
-
Precise Tuning of Polymeric Fiber Dimensions to Enhance the Mechanical Properties of Alginate Hydrogel Matrices.Polymers (Basel). 2021 Jul 2;13(13):2202. doi: 10.3390/polym13132202. Polymers (Basel). 2021. PMID: 34279346 Free PMC article.
-
Mechanical properties of cell sheets and spheroids: the link between single cells and complex tissues.Biophys Rev. 2021 Jul 13;13(4):541-561. doi: 10.1007/s12551-021-00821-w. eCollection 2021 Aug. Biophys Rev. 2021. PMID: 34471438 Free PMC article. Review.
-
Anisotropy in mechanical unfolding of protein upon partner-assisted pulling and handle-assisted pulling.Commun Biol. 2021 Jul 29;4(1):925. doi: 10.1038/s42003-021-02445-y. Commun Biol. 2021. PMID: 34326473 Free PMC article.
-
An amino acid mixture, enriched with Krebs cycle intermediates, enhances extracellular matrix gene expression in cultured human fibroblasts.Amino Acids. 2023 Nov;55(11):1679-1685. doi: 10.1007/s00726-023-03340-y. Epub 2023 Sep 28. Amino Acids. 2023. PMID: 37768394 Free PMC article.
References
-
- Salacinski H.J., Goldner S., Giudiceandrea A., Hamilton G., Seifalian A.M., Edwards A., Carson R.J. The mechanical behavior of vascular grafts: a review. J. Biomater. Appl. 2001;15:241–278. - PubMed
-
- Fung Y.C. Springer-Verlag; New York: 1981. Biomechanics: Mechanical Properties of Living Tissues.
-
- Sims J.R., Karp S., Ingber D.E. Altering the cellular mechanical force balance results in integrated changes in cell, cytoskeletal and nuclear shape. J. Cell Sci. 1992;103:1215–1222. - PubMed
-
- Chen C.S., Mrksich M., Huang S., Whitesides G.M., Ingber D.E. Geometric control of cell life and death. Science. 1997;276:1425–1428. - PubMed
Publication types
MeSH terms
Substances
Grants and funding
LinkOut - more resources
Full Text Sources
Other Literature Sources
