. 2008 Mar 1;94(5):1551-64.
doi: 10.1529/biophysj.107.106484. Epub 2007 Nov 9.

Microscopic simulation of membrane molecule diffusion on corralled membrane surfaces

Affiliations

Microscopic simulation of membrane molecule diffusion on corralled membrane surfaces

Anne Marie S Niehaus et al. Biophys J. .

Abstract

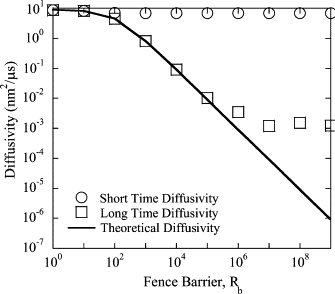
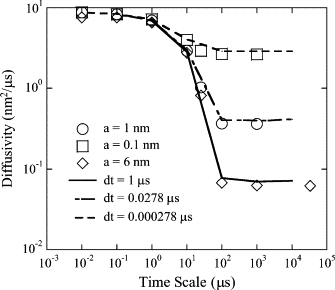
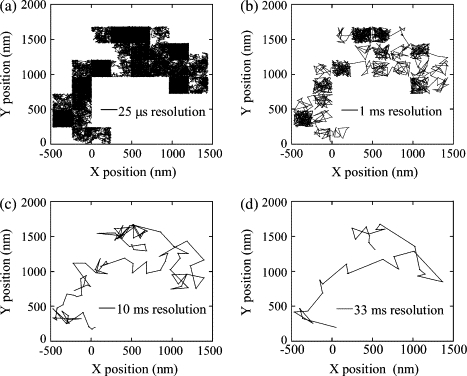
The current understanding of how receptors diffuse and cluster in the plasma membrane is limited. Data from single-particle tracking and laser tweezer experiments have suggested that membrane molecule diffusion is affected by the presence of barriers dividing the membrane into corrals. Here, we have developed a stochastic spatial model to simulate the effect of corrals on the diffusion of molecules in the plasma membrane. The results of this simulation confirm that a fence barrier (the ratio of the transition probability for diffusion across a boundary to that within a corral) on the order of 10(3)-10(4) recreates the experimentally measured difference in diffusivity between artificial and natural plasma membranes. An expression for the macroscopic diffusivity of receptors on corralled membranes is derived to analyze the effects of the corral parameters on diffusion rate. We also examine whether the lattice model is an appropriate description of the plasma membrane and look at three different sets of boundary conditions that describe diffusion over the barriers and whether diffusion events on the plasma membrane may occur with a physically relevant length scale. Finally, we show that to observe anomalous (two-timescale) diffusion, one needs high temporal (microsecond) resolution along with sufficiently long (more than milliseconds) trajectories.


Figures

Figure 1
Figure 1
Mean-squared displacement curves for simulations of receptors diffusing on a membrane with a lattice of 600 × 600 nm corrals and fence barriers ranging from 1 to 109. (Open circles) Rb = 1 (no fence); (open squares) Rb = 10; (open diamonds) Rb = 100; (solid circles) Rb = 103; (solid squares) Rb = 104; curves with higher Rbs are indistinguishable from each other on this plot. Increasing the fence ratio (Rb) decreases the MSD at moderate to long times.
Figure 2
Figure 2
Long- and short-time diffusivities for simulations at various fence barrier values and a corral size of 600 × 600 nm. Short-time diffusivities are calculated at the first ∼103 μs, and long-time diffusivities are calculated from simulation data collected between 2 × 104 and 1 × 105 μs. The theoretical diffusivity is obtained from Eq. 13. The deviation between the long-time diffusivity and the theoretical diffusivity is due to poor statistics of the KMC for large fence barriers.
Figure 3
Figure 3
Single-particle trajectories from simulations with resolutions of (a) 33 ms and (b) 25 μs over a period of 1 s. Corral size is 240 nm × 240 nm and barrier height is Rb = 103. The diffusion in a appears to be Brownian, whereas in b it is corralled.
Figure 4
Figure 4
(a) Initial calculated diffusivity from points 2–4 taken at the intervals indicated. The average is taken over 10 simulations of 10,000 corrals with 1% coverage of receptors and a fence barrier value of Rb = 103, Dmicro = 9 nm2/μs. (Open symbols and lines) diffusivities calculated from simulation results; (circles) 42-nm corrals; (squares) 120-nm corrals; (diamonds) 240-nm corrals; (solid triangles) data from Murase et al. for the measured diffusivity of particles on FRSK cells (average compartment size, 41 nm) at resolutions of 25 μs (fast resolution) and 33 ms (video rate). The inset is a blowup (in linear scale) of the short-term diffusivity. (b) Plot of MSD over four times the time (MSD/4t) for the same simulation results.
Figure 5
Figure 5
(a) Diffusivity calculated from simulation points 2–4 at a given resolution for receptors with a self-diffusivity of 9 nm2/μs diffusing on a lattice of corrals with a fence barrier, Rb, of 103. Diamonds are experimental data from Murase et al. measured by single-particle tracking with a resolution of 25 μs. (b) MSD over four times the time, MSD/4t, at each data point taken during simulations.
Figure 6
Figure 6
Parity plot comparing diffusivities obtained by simulation and calculated theoretically by the coarse-grained method. Results are averaged over 100,000 iterations for a single corral with periodic boundary conditions. Except for the parameter being varied, parameters are as follows: corral size, 240 nm × 240 nm; coverage, 0.01; Γd = 0.25; and Γf = 0.00025. Circles show variation in corral size (120–600 nm2); squares show variation in coverage (0.01–0.1); diamonds show variation in Γd (0.0005–0.25); and Xs show variation in Γf (0.25 × 10−6 to 0.25).
Figure 7
Figure 7
Diffusivity calculated at various timescales from simulations of receptors diffusing over 42-nm corrals with a fence barrier of Rb = 103 on a lattice of 0.1-, 1-, and 6-nm sites.
Figure 8
Figure 8
Diffusivity calculated from simulations of receptors diffusing on a surface with 42-nm corrals having an Rb value of 103. Symbols are results from lattice simulations with varying lattice constants, and lines represent results from off-lattice simulations with different time steps. Time steps of 1 μs, 0.0278 μs, and 0.000278 μs correspond to average step sizes of 6 nm, 1 nm, and 0.1 nm, respectively.
Figure 9
Figure 9
Diffusivities calculated from lattice-based simulations of receptors diffusing on a 42-nm corral with a constant propensity for crossing a barrier of 2.5 × 10−4 with Dmicro = 9 nm2/μs.
Figure 10
Figure 10
Variation of the fence barrier (Γdf) with the lattice constant. Γd is calculated from Eq. 29 and Γf is calculated from Eq. 30.
Figure 11
Figure 11
Diffusivity calculated at a time resolution of 0.01 μs versus the lattice constant. Error bars are standard deviations (>100 samples of 4900 receptors).
Figure 12
Figure 12
Diffusivity calculated at a time resolution of 25 μs versus the lattice constant. At this timescale, the diffusivity is independent of the lattice constant. Error bars are standard deviations (>100 samples of 4900 receptors).
Figure 13
Figure 13
Trajectory plots for identical conditions with (a) 25-μs, (b) 1-ms, (c) 10-ms, and (d) 33-ms resolutions. Each trajectory is for a total time of 1 s.
Figure 14
Figure 14
MSD plots for identical conditions with (a) 25-μs, (b) 1-ms, (c) 10-ms, and (d) 33-ms resolutions. (a) The diffusivities are given for time near zero and at 1.5 ms. (bd) The diffusivities given are calculated from the slope of 3 points (indicated by lines) at time near 0, at ∼200 ms, and at ∼400 ms. The initial diffusivities are all calculated from points 2–4 in the plot. Only the data for 25 μs yield a diffusivity close to the microscopic value of 9 nm2/μs.

References

    1. Johnson G.L., Vaillancourt R.R. Sequential protein kinase reactions controlling cell growth and differentiation. Curr. Opin. Cell Biol. 1994;6:230–238. - PubMed
    1. Saez-Rodrigues J., Kremling A., Conzelmann H., Bettenbrock K., Gilles E.D. Modular analysis of signal transduction networks. IEEE Contr. Syst. Mag. 2004;24:35–52.
    1. Holbro T., Civenni G., Hynes N.E. The ErbB receptors and their role in cancer progression. Exp. Cell Res. 2003;284:99–110. - PubMed
    1. Nicholson R.I., Gee J.M.W., Harper M.E. EGFR and cancer prognosis. Eur. J. Cancer. 2001;37:S9–S15. - PubMed
    1. Jorissen R.N., Walker F., Pouliot N., Garrett T.P.J., Ward C.W., Burgess A.W. Epidermal growth factor receptor: mechanisms of activation and signaling. Exp. Cell Res. 2003;284:31–53. - PubMed

Substances

LinkOut - more resources