

Paxillin dynamics measured during adhesion assembly and disassembly by correlation spectroscopy
- PMID: 17993500
- PMCID: PMC2267137
- DOI: 10.1529/biophysj.107.104984
Paxillin dynamics measured during adhesion assembly and disassembly by correlation spectroscopy
Erratum in
- Biophys J. 2008 Jun;94(11):4577
Abstract
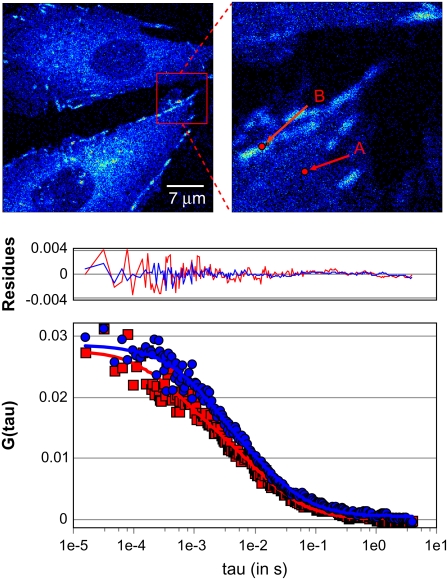
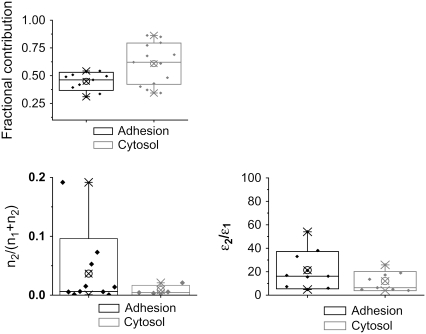
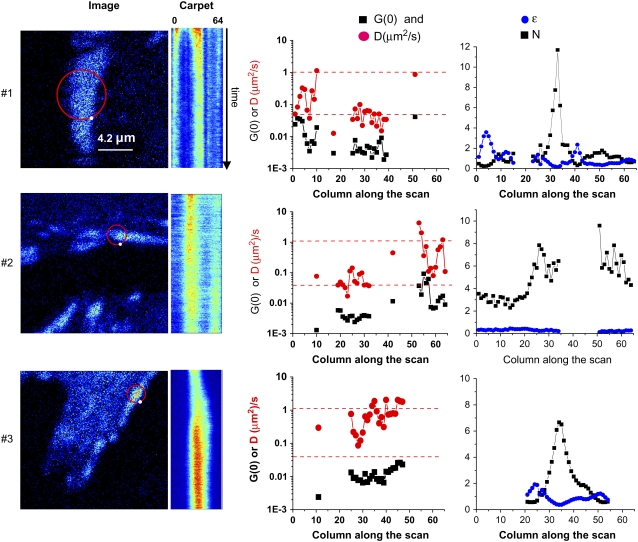
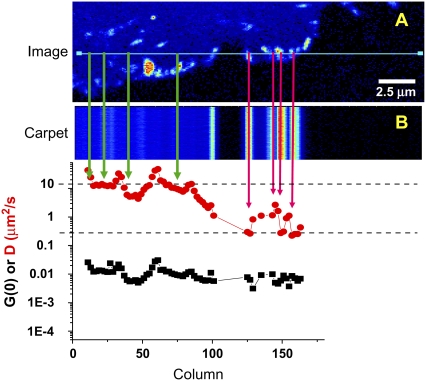
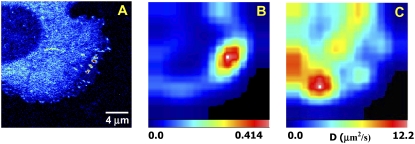
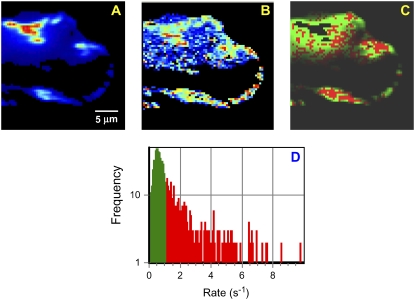
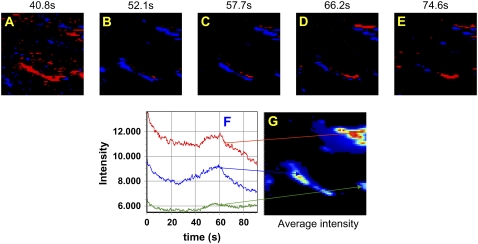
Paxillin is an adaptor molecule involved in the assembly of focal adhesions. Using different fluorescence fluctuation approaches, we established that paxillin-EGFP is dynamic on many timescales within the cell, ranging from milliseconds to seconds. In the cytoplasmic regions, far from adhesions, paxillin is uniformly distributed and freely diffusing as a monomer, as determined by single-point fluctuation correlation spectroscopy and photon-counting histogram analysis. Near adhesions, paxillin dynamics are reduced drastically, presumably due to binding to protein partners within the adhesions. The photon-counting histogram analysis of the fluctuation amplitudes reveals that this binding equilibrium in new or assembling adhesions is due to paxillin monomers binding to quasi-immobile structures, whereas in disassembling adhesions or regions of adhesions, the equilibrium is due to exchange of large aggregates. Scanning fluctuation correlation spectroscopy and raster-scan image correlation spectroscopy analysis of laser confocal images show that the environments within adhesions are heterogeneous. Relatively large adhesions appear to slide transversally due to a treadmilling mechanism through the addition of monomeric paxillin at one side and removal of relatively large aggregates of proteins from the retracting edge. Total internal reflection microscopy performed with a fast acquisition EM-CCD camera completes the overall dynamic picture and adds details of the heterogeneous dynamics across single adhesions and simultaneous bursts of activity at many adhesions across the cell.
Figures
Similar articles
-
Cross-correlated fluctuation analysis reveals phosphorylation-regulated paxillin-FAK complexes in nascent adhesions.Biophys J. 2011 Feb 2;100(3):583-592. doi: 10.1016/j.bpj.2010.12.3719. Biophys J. 2011. PMID: 21281572 Free PMC article.
-
Paxillin S273 Phosphorylation Regulates Adhesion Dynamics and Cell Migration through a Common Protein Complex with PAK1 and βPIX.Sci Rep. 2019 Aug 7;9(1):11430. doi: 10.1038/s41598-019-47722-3. Sci Rep. 2019. PMID: 31391572 Free PMC article.
-
Paxillin phosphorylation at serine 273 and its effects on Rac, Rho and adhesion dynamics.PLoS Comput Biol. 2018 Jul 5;14(7):e1006303. doi: 10.1371/journal.pcbi.1006303. eCollection 2018 Jul. PLoS Comput Biol. 2018. PMID: 29975690 Free PMC article.
-
Dissecting single-cell molecular spatiotemporal mobility and clustering at focal adhesions in polarised cells by fluorescence fluctuation spectroscopy methods.Methods. 2018 May 1;140-141:85-96. doi: 10.1016/j.ymeth.2018.03.008. Epub 2018 Mar 30. Methods. 2018. PMID: 29605734
-
Advances in image correlation spectroscopy: measuring number densities, aggregation states, and dynamics of fluorescently labeled macromolecules in cells.Cell Biochem Biophys. 2007;49(3):141-64. doi: 10.1007/s12013-007-9000-5. Epub 2007 Oct 2. Cell Biochem Biophys. 2007. PMID: 17952641 Review.
Cited by
-
Correlation of cellular traction forces and dissociation kinetics of adhesive protein zyxin revealed by multi-parametric live cell microscopy.PLoS One. 2021 May 11;16(5):e0251411. doi: 10.1371/journal.pone.0251411. eCollection 2021. PLoS One. 2021. PMID: 33974655 Free PMC article.
-
Systems microscopy approaches to understand cancer cell migration and metastasis.Cell Mol Life Sci. 2010 Oct;67(19):3219-40. doi: 10.1007/s00018-010-0419-2. Epub 2010 Jun 18. Cell Mol Life Sci. 2010. PMID: 20556632 Free PMC article. Review.
-
Actomyosin-generated tension controls the molecular kinetics of focal adhesions.J Cell Sci. 2011 May 1;124(Pt 9):1425-32. doi: 10.1242/jcs.077388. Epub 2011 Apr 12. J Cell Sci. 2011. PMID: 21486952 Free PMC article.
-
Mapping diffusion in a living cell via the phasor approach.Biophys J. 2014 Dec 16;107(12):2775-2785. doi: 10.1016/j.bpj.2014.08.041. Biophys J. 2014. PMID: 25517145 Free PMC article.
-
A kindlin-3-leupaxin-paxillin signaling pathway regulates podosome stability.J Cell Biol. 2019 Oct 7;218(10):3436-3454. doi: 10.1083/jcb.201903109. Epub 2019 Sep 19. J Cell Biol. 2019. PMID: 31537712 Free PMC article.
References
-
- Lauffenburger, D. A., and A. F. Horwitz. 1996. Cell migration: a physically integrated molecular process. Cell. 84:359–369. - PubMed
-
- Ridley, A. J. 2004. Rho proteins and cancer. Breast Cancer Res. Treat. 84:13–19. - PubMed
-
- Webb, D. J., K. Donais, L. A. Whitmore, S. M. Thomas, C. E. Turner, J. T. Parsons, and A. F. Horwitz. 2004. FAK-Src signalling through paxillin, ERK and MLCK regulates adhesion disassembly. Nat. Cell Biol. 6:154–161. - PubMed
-
- Webb, D. J., J. T. Parsons, and A. F. Horwitz. 2002. Adhesion assembly, disassembly and turnover in migrating cells—over and over and over again. Nat. Cell Biol. 4:E97–E100. - PubMed
-
- Geiger, B., A. Bershadsky, R. Pankov, and K. M. Yamada. 2001. Transmembrane crosstalk between the extracellular matrix—cytoskeleton crosstalk. Nat. Rev. Mol. Cell Biol. 2:793–805. - PubMed
Publication types
MeSH terms
Substances
Grants and funding
LinkOut - more resources
Full Text Sources
Other Literature Sources
