. 2008 Feb 15;94(4):1497-507.
doi: 10.1529/biophysj.106.098574. Epub 2007 Nov 9.

Role of cyclic strain frequency in regulating the alignment of vascular smooth muscle cells in vitro

Affiliations

Role of cyclic strain frequency in regulating the alignment of vascular smooth muscle cells in vitro

Bo Liu et al. Biophys J. .

Abstract

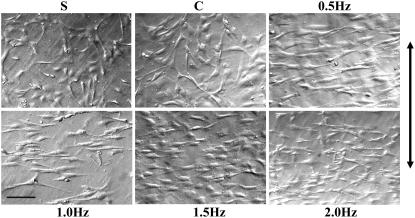
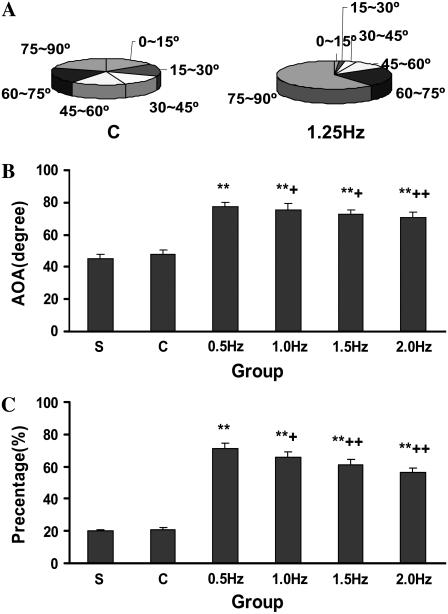
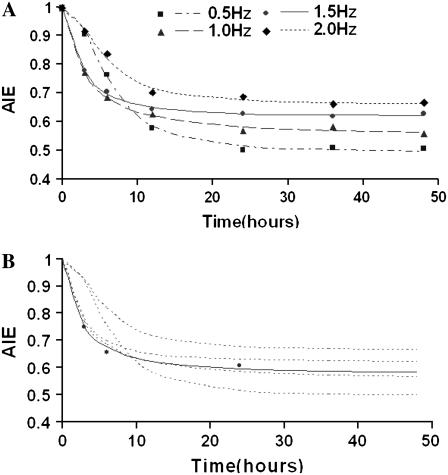
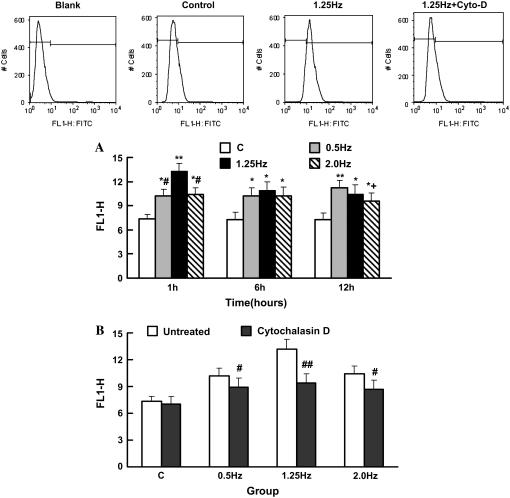
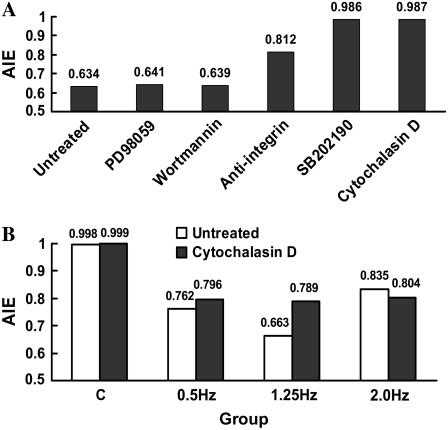
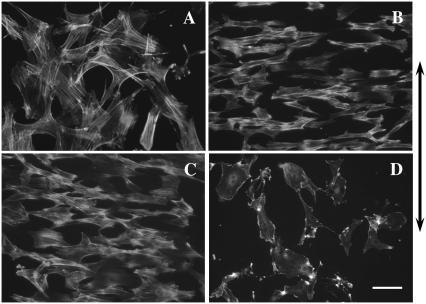
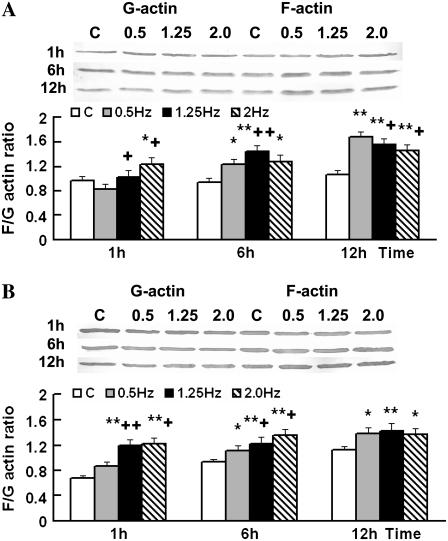
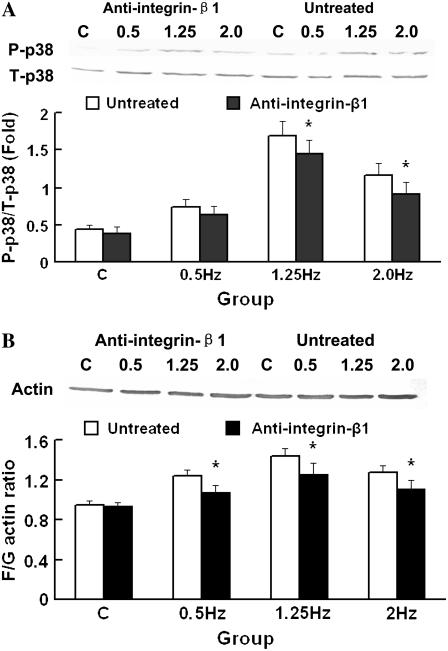
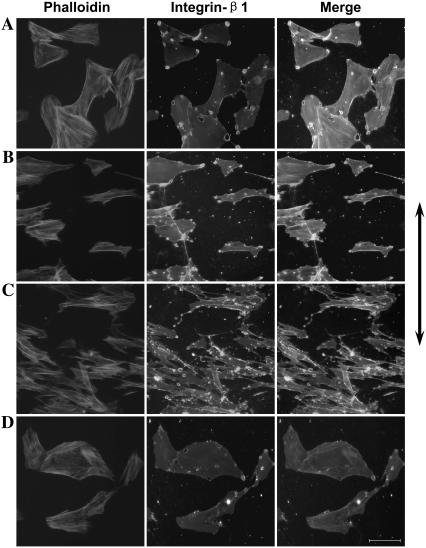
The arterial system is subjected to cyclic strain because of periodic alterations in blood pressure, but the effects of frequency of cyclic strain on arterial smooth muscle cells (SMCs) remain unclear. Here, we investigated the potential role of the cyclic strain frequency in regulating SMC alignment using an in vitro model. Aortic SMCs were subject to cyclic strain at one elongation but at various frequencies using a Flexercell Tension Plus system. It was found that the angle information entropy, the activation of integrin-beta1, p38 MAPK, and F/G actin ratio of filaments were all changed in a frequency-dependent manner, which was consistent with SMC alignment under cyclic strain with various frequencies. A treatment with anti-integrin-beta1 antibody, SB202190, or cytochalasin D inhibited the cyclic strain frequency-dependent SMC alignment. These observations suggested that the frequency of cyclic strain plays a role in regulating the alignment of vascular SMCs in an intact actin filament-dependent manner, and cyclic strain at 1.25 Hz was the most effective frequency influencing SMC alignment. Furthermore, integrin-beta1 and p38 MAPK possibly mediated cyclic strain frequency-dependent SMC alignment.


Figures

FIGURE 1
FIGURE 1
Change of SMC alignment after stretching at a variety of frequencies. SMCs were cultured on collagen I-coated elastic membranes and subjected to cyclic stretch with frequencies 0.5, 1.0, 1.5, and 2.0 Hz, respectively, for 24 h. Photographs were taken under microscopy, and their middle vertical lines were fixed consistently with the radial direction of the culture membrane. SMCs without stretch (S group) or statically stretched without variation in frequency (C group) were also observed. Bar, 200 μm, and the arrow indicates the radial direction.
FIGURE 2
FIGURE 2
Change of SMC orientation after stretching at a variety of frequencies. The angle of SMCs (0–90°) was divided into six angle regions, each covering 15°. The percentages of SMCs within the C and 1.5-Hz groups were calculated after stretching for 24 h (A). The AOA (B) and the percentage of SMCs from 75° to 90° (C) were contrasted between groups. Results are mean ± SD. *p < 0.05; **p < 0.01 versus the C group; +p < 0.05; ++p < 0.01 versus the 0.5-Hz group, n = 4.
FIGURE 3
FIGURE 3
Time courses of AIE change with different frequencies of cyclic stretch from the experimental and mathematic models. (A) SMCs were stretched for 3, 6, 12, 24, 36, and 48 h with frequencies of 0.5, 1.0, 1.5, and 2.0 Hz, respectively, and the C group was also observed at the same time points. Based on the data of the percentage of cells in each angle interval, the AIE was calculated and contrasted. The time courses of AIE were fitted with a logistic curve, and the frequency and each parameter were then fitted again using the power function or binomial equation. The lines are fitted curves, and spots represent the corresponding experimental data; n = 4. (B). Prediction and experimental verification of AIE. The AIE under the cyclic stretch frequency of 1.2 Hz were predicted, and for experimental verification, SMCs were stretched with a frequency of 1.2 Hz for 3, 6, and 24 h, respectively. The dotted lines are fitted curves for each experimental group, the solid line is a predicted curve for 1.2 Hz, and spots represent experimental data; n = 7.
FIGURE 4
FIGURE 4
Activation of integrin-β1 in SMCs under different frequencies of cyclic strain analyzed by flow cytometry. (A) SMCs were analyzed by flow cytometry after stretched for 1, 6, and 12 h with frequencies of 0.5, 1.25, and 2.0 Hz, respectively. Results are mean ± SD. *p < 0.05, **p < 0.01 versus C group of the same time point; +p < 0.05 versus 0.5-Hz group of the same time point; #p < 0.05 versus 1.25-Hz group of the same time point; n = 4. (B) Activation of integrin-β1 in SMCs stretched for 1 h without cytochalasin D after pretreatment with cytochalasin D for 1 h. Results are mean ± SD. #p < 0.05, ##p < 0.01 versus the untreated group of the same time point; n = 4.
FIGURE 5
FIGURE 5
Change of AIE of SMCs under cyclic strain after pretreatment with specific inhibitors. (A) SMCs were stretched after pretreatment with different inhibitors for 1 h and stretched at 1.25 Hz for 12 h with specific inhibitors in the medium. (B) Change of AIE of SMCs stretched at different frequencies for 6 h without cytochalasin D in the medium after pretreatment with cytochalasin D for 1 h, n = 4.
FIGURE 6
FIGURE 6
Change of filament orientation after cyclic stretching. (A) Control group, which was statically stretched without frequency for 12 h. (B) SMCs stretched at the frequency of 1.25 Hz for 6 h. (C) SMCs stretched for 12 h at the frequency of 1.25 Hz after pretreatment with cytochalasin D for 1 h. (D) SMCs were stretched for 12 h at the frequency of 1.25 Hz with cytochalasin D in the medium throughout. Stained with rhodamine phalloidin. Bar, 100 μm, and the arrow indicates the radial direction of the culture membrane.
FIGURE 7
FIGURE 7
F/G-actin ratio changed with different frequencies of cyclic strain while disturbed by cytochalasin D. SMCs were stretched for 1, 6, and 12 h (A) or stretched for the same time after pretreatment with cytochalasin D for 1 h (B). G-actin in cytosol protein and F-actin in cytoskeleton protein were immunoblotted with anti-β-actin antibody. Each column represents the mean ± SD. *p < 0.05; **p < 0.01 versus the C group at the same time point; +p < 0.05; ++p < 0.01 versus the 0.5-Hz group at the same time point; n = 5.
FIGURE 8
FIGURE 8
Change of phospho-p38 MAPK (P-p38) induction and F/G-actin ratio of SMCs stretched after having been inhibited with anti-integrin-β1 blocking antibody. (A) Western blotting result from P-p38 after stretching for 1 h with anti-integrin-β1 blocking antibody, and total-p38 MAPK (T-p38) served as loading control. (B) The F/G-actin ratio of SMCs after stretching for 12 h with anti-integrin-β1 blocking antibody. Each column represents the mean ± SD. +p < 0.05; ++p < 0.01 versus the C group; #p < 0.05; ##p < 0.01 versus the 1.25 Hz group; *p < 0.05 versus the untreated group at the same frequency; n = 5.
FIGURE 9
FIGURE 9
Immunocytochemistry result of actin and integrin-β1. (A) C group, in which SMCs were stretched without frequency. (B) SMCs were stretched at 1.25 Hz for 6 h. (C) SMCs were stretched at 1.25 Hz for 12 h. (D) SMCs were stretched at 1.25 Hz for 6 h after pretreatment with cytochalasin D for 1 h. The cells were fixed, and actin filament was stained with red rhodamine-phalloidin, and integrin-β1 was stained with an anti-integrin-β1 antibody and green FITC-IgG, respectively. Photographs were taken with the fluorescence microscope. Bar, 100 μm, and the arrow indicates the radial direction.

Similar articles

Cited by

References

    1. Tranquillo, R. T., T. S. Girton, B. A. Bromberek, T. G. Triebes, and D. L. Mooradian. 1996. Magnetically orientated tissue-equivalent tubes: application to a circumferentially orientated media-equivalent. Biomaterials. 17:349–357. - PubMed
    1. Finlay, H. M., P. Whittaker, and P. B. Canham. 1998. Collagen organization in the branching region of human brain arteries. Stroke. 29:1595–1601. - PubMed
    1. L'Heureux, N., L. Germain, R. Labbe, and F. A. Auger. 1993. In vitro construction of a human blood vessel from cultured vascular cells: a morphologic study. J. Vasc. Surg. 17:499–509. - PubMed
    1. Standley, P. R., A. Cammarata, B. P. Nolan, C. T. Purgason, and M. A. Stanley. 2002. Cyclic stretch induces vascular smooth muscle cell alignment via NO signaling. Am. J. Physiol. Heart Circ. Physiol. 283:H1907–H1914. - PubMed
    1. Kanda, K., and T. Matsuda. 1993. Behavior of arterial wall cells cultured on periodically stretched substrates. Cell Transplant. 2:475–484. - PubMed

Publication types

LinkOut - more resources