Interaction of Bacillus subtilis CodY with GTP
- PMID: 17993518
- PMCID: PMC2223590
- DOI: 10.1128/JB.01115-07
Interaction of Bacillus subtilis CodY with GTP
Abstract
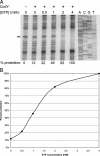
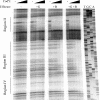
Many of the adaptive mechanisms that allow Bacillus subtilis to adjust to changes in nutrient availability are controlled by CodY. Binding of CodY to its target genes is stimulated by interaction with its effectors, GTP and the branched-chain amino acids (BCAAs). Upon nutrient limitation, intracellular pools of these effectors are depleted and CodY can no longer repress genes required for adaptation. In vitro studies reported here explored in more detail the interaction of CodY with GTP. DNase I footprinting experiments indicated that CodY has an affinity for GTP in the millimolar range. Further, CodY was shown to interact specifically with GTP and dGTP; no other naturally occurring nucleotides that were tested, including ppGpp and pppGpp, resulted in DNA protection. Two nonhydrolyzable analogs of GTP were fully able to activate CodY binding to target DNA, demonstrating that GTP hydrolysis is not necessary for CodY-dependent regulation. GTP and the BCAAs were shown to act additively to increase the affinity of CodY for DNA; increased protection was observed in DNase I footprinting experiments when both effectors were present, compared to either effector alone, and in in vitro transcription reactions, transcriptional repression by CodY was stronger in the presence of both GTP and BCAAs than of BCAAs alone. Thus, interaction of CodY with GTP is specific and results in increased affinity for its target genes. This increase in affinity is independent of GTP hydrolysis and is augmented in the presence of BCAAs.
Figures


Similar articles
-
Activation of the Bacillus subtilis global regulator CodY by direct interaction with branched-chain amino acids.Mol Microbiol. 2004 Jul;53(2):599-611. doi: 10.1111/j.1365-2958.2004.04135.x. Mol Microbiol. 2004. PMID: 15228537
-
CodY is a nutritional repressor of flagellar gene expression in Bacillus subtilis.J Bacteriol. 2003 May;185(10):3118-26. doi: 10.1128/JB.185.10.3118-3126.2003. J Bacteriol. 2003. PMID: 12730172 Free PMC article.
-
Intracellular effectors regulating the activity of the Lactococcus lactis CodY pleiotropic transcription regulator.Mol Microbiol. 2004 Jul;53(2):613-21. doi: 10.1111/j.1365-2958.2004.04136.x. Mol Microbiol. 2004. PMID: 15228538
-
The CodY pleiotropic repressor controls virulence in gram-positive pathogens.FEMS Immunol Med Microbiol. 2011 Jul;62(2):123-39. doi: 10.1111/j.1574-695X.2011.00812.x. Epub 2011 May 27. FEMS Immunol Med Microbiol. 2011. PMID: 21539625 Review.
-
Intersection of the stringent response and the CodY regulon in low GC Gram-positive bacteria.Int J Med Microbiol. 2014 Mar;304(2):150-5. doi: 10.1016/j.ijmm.2013.11.013. Epub 2013 Dec 1. Int J Med Microbiol. 2014. PMID: 24462007 Review.
Cited by
-
Role of branched-chain amino acid transport in Bacillus subtilis CodY activity.J Bacteriol. 2015 Apr;197(8):1330-8. doi: 10.1128/JB.02563-14. Epub 2015 Feb 2. J Bacteriol. 2015. PMID: 25645558 Free PMC article.
-
MudPIT profiling reveals a link between anaerobic metabolism and the alkaline adaptive response of Listeria monocytogenes EGD-e.PLoS One. 2013;8(1):e54157. doi: 10.1371/journal.pone.0054157. Epub 2013 Jan 14. PLoS One. 2013. PMID: 23342094 Free PMC article.
-
A shared alarmone-GTP switch underlies triggered and spontaneous persistence.Res Sq [Preprint]. 2025 Jan 3:rs.3.rs-5679108. doi: 10.21203/rs.3.rs-5679108/v1. Res Sq. 2025. Update in: Nat Microbiol. 2025 Jul;10(7):1617-1629. doi: 10.1038/s41564-025-02015-6. PMID: 39801512 Free PMC article. Updated. Preprint.
-
Genetic and biochemical analysis of CodY-binding sites in Bacillus subtilis.J Bacteriol. 2008 Feb;190(4):1224-36. doi: 10.1128/JB.01780-07. Epub 2007 Dec 14. J Bacteriol. 2008. PMID: 18083814 Free PMC article.
-
Diverse molecular mechanisms of transcription regulation by the bacterial alarmone ppGpp.Mol Microbiol. 2022 Feb;117(2):252-260. doi: 10.1111/mmi.14860. Epub 2021 Dec 25. Mol Microbiol. 2022. PMID: 34894005 Free PMC article. Review.
References
-
- Blagova, E. V., V. M. Levdikov, K. Tachikawa, A. L. Sonenshein, and A. J. Wilkinson. 2003. Crystallization of the GTP-dependent transcriptional regulator CodY from Bacillus subtilis. Acta Crystallogr. D Biol. Crystallogr. 59155-157. - PubMed
-
- Bochner, B. R., and B. N. Ames. 1982. Complete analysis of cellular nucleotides by two-dimensional thin layer chromatography. J. Biol. Chem. 2579759-9769. - PubMed
-
- Bourne, H. R., D. A. Sanders, and F. McCormick. 1991. The GTPase superfamily: conserved structure and molecular mechanism. Nature 349117-127. - PubMed
-
- Carey, J. 2000. A systematic and general proteolytic method for defining structural and functional domains of proteins. Methods Enzymol. 328499-514. - PubMed
Publication types
MeSH terms
Substances
Grants and funding
LinkOut - more resources
Full Text Sources
Molecular Biology Databases

