. 2008 Feb 1;111(3):1700-8.
doi: 10.1182/blood-2007-06-098178. Epub 2007 Nov 9.

Adherence to macrophages in erythroblastic islands enhances erythroblast proliferation and increases erythrocyte production by a different mechanism than erythropoietin

Affiliations

Adherence to macrophages in erythroblastic islands enhances erythroblast proliferation and increases erythrocyte production by a different mechanism than erythropoietin

Melissa M Rhodes et al. Blood. .

Abstract

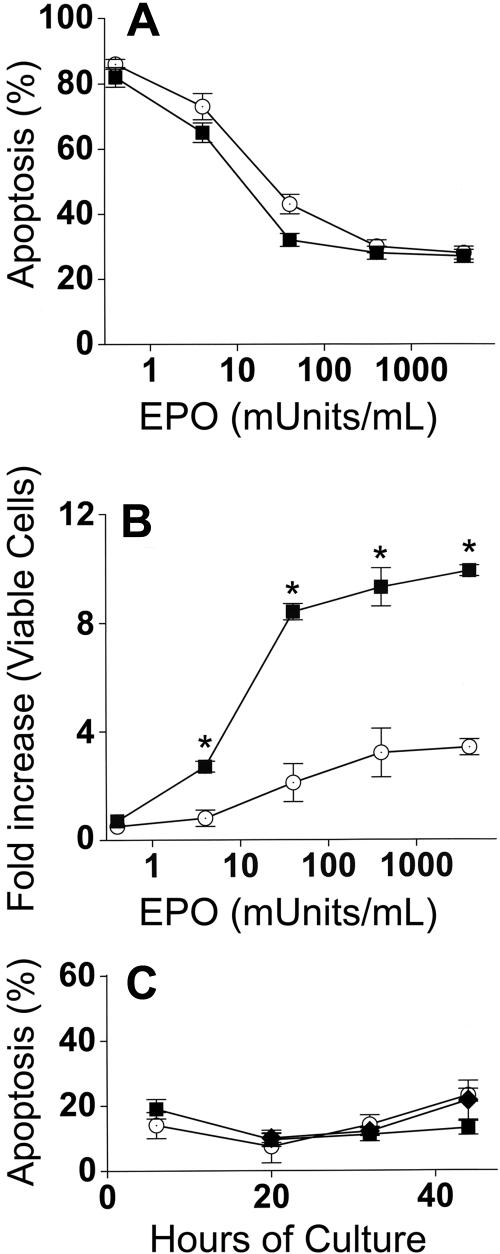
Erythroblasts adhere to central macrophages forming erythroblastic islands in hematopoietic tissues, but the function of these islands is not understood. Murine erythroblastic islands were reconstituted in vitro with macrophages and developmentally synchronous proerythroblasts. Erythroblasts cocultured with macrophages proliferated 3-fold greater than erythroblasts cultured alone. Direct contact with the macrophages was necessary for this enhanced erythroblast proliferation, which resulted from decreased transit time in the G(0)/G(1) phase of cell cycle. Increased erythroblast proliferation in erythroblastic islands occurred over a wide range of erythropoietin concentrations and was the result of a mechanism different from the antiapoptotic effect of erythropoietin. Erythroblasts adherent to macrophages had slightly delayed enucleation, but otherwise differentiation was similar to erythroblasts cultured alone or those that became nonadherent in cocultures. These results suggest a mechanism for the development of anemias associated with abnormal macrophage function and for reduced responsiveness of those anemias to erythropoietin therapy.


Figures

Figure 1
Figure 1
Erythroblastic islands can be reconstituted with splenic macrophages and developmentally synchronized CFU-E/proerythroblasts from the spleens of Friend virus-infected mice. (Left) Photomicrographs of cultures fixed in situ at 6 hours of coculture. (Top panel) Purified, Wright-stained splenic macrophages attached to tissue culture plates. These macrophages did not receive erythroblasts for coculture. The lower 2 panels in the left column show adherent erythroblasts that reconstituted erythroblastic islands at 6 hours of coculture. Arrows point to macrophage nuclei. The remaining columns show photomicrographs of 3,3′-dimethoxybenzidine and hematoxylin-stained cytocentrifuge preparations of control erythroblasts cultured without macrophages (Cont), nonadherent erythroblasts from cocultures with macrophages (NonAdh), and erythroblasts that were adherent to macrophages (Adh) at 20, 32, and 44 hours of culture. At 20 hours, almost all cells are proerythroblasts, which accumulate heme (amber stain) by 32 hours. At 44 hours, control and nonadherent cultures have numerous reticulocytes (enucleated, amber cells) and extruded nuclei (dense, round, purple bodies). Slightly fewer adherent cells have enucleated at this time. Bar represents 10 μm.
Figure 2
Figure 2
Coculture with macrophages in reconstituted erythroblastic islands increases proliferation of FVA erythroblasts. (A) Fold increase in total numbers of FVA erythroblasts cocultured with macrophages in reconstituted erythroblastic islands (■) and in control cultures without macrophages (○). Control cultures increased from 5 × 10⁵ erythroblasts/mL at 6 hours to 2.3 × 10⁶ erythroblasts/mL at 44 hours. Cocultures increased from 0.9 × 10⁵ erythroblasts/mL to 1.2 × 10⁶ erythroblasts/mL. (B) Fold increase in FVA erythroblasts of adherent erythroblasts in cocultures (formula image), nonadherent erythroblasts in cocultures (■), and in control cultures (○). Results are the means plus or minus SE from 24 separate experiments; increased accumulations of erythroblasts in cocultures compared with control cultures were significant (*P < .001) at all times after 6 hours.
Figure 3
Figure 3
The enhanced proliferation of erythroblasts in cocultures requires direct contact with macrophages and is unrelated to FVA infection. (A) Effect of removing adherent erythroblasts from macrophages on their fold increase in subsequent culture. indicates adherent erythroblasts cultured in cocultures; , control erythroblasts cultured alone; , adherent erythroblasts removed from macrophages and recultured alone. Adherent erythroblast accumulations in coculture were significantly greater at all times than control erythroblasts or formerly adherent erythroblasts that were cultured alone (*P < .002). (B) Effect of macrophage-conditioned medium at various concentrations (○, 0%; ◇, 8%; ◀, 16%; ▶, 30%; □, 60%) on fold increase in total erythroblasts cultured alone; erythroblasts cocultured with macrophages (■). Erythroblasts in cocultures accumulated to significantly greater numbers than in any concentration of conditioned medium (*P < .05). (C) Fold increase in splenic erythroblasts of bled mice, cocultured with splenic macrophages (■), and cultured alone as controls (○). Data are means plus or minus SE of 3 separate experiments for each part; no significant increases above controls were found for formerly adherent erythroblasts cultured alone (P < .1-.47) or erythroblasts cultured with any concentration of macrophage-conditioned medium (P < .25-.5), whereas erythroblasts from bled mice were always increased significantly in cocultures compared with controls (*P < .004-.4).
Figure 4
Figure 4
Increased accumulation of erythroblasts in cocultures with macrophages occurs at all EPO concentrations. (A) Percentages of apoptotic (TUNEL-positive) cells at 44 hours after culture in various concentrations of EPO. In cocultures, apoptosis percentages for adherent and nonadherent erythroblasts were the same at all concentrations of EPO, and totals of both populations (■) are shown; control erythroblasts (○). (B) Fold increases of total viable erythroblasts in cocultures (adherent + nonadherent) (■) and viable control erythroblasts (○) from 6 hours to 44 hours at various EPO concentrations. Increased erythroblast accumulations in cocultures compared with controls were significant at all added EPO concentrations (*P < .05). (C) Erythroblasts at various times of culture were analyzed by TUNEL assays for percentage of apoptotic cells: adherent erythroblasts (■), nonadherent erythroblasts (♦), control erythroblasts (○). Results are the means plus or minus SE from 3 separate experiments in each part.
Figure 5
Figure 5
Adherence to macrophages in coculture increases proliferation of erythroblasts by decreasing G0/G1 transit time. (A) Percentages of nonapoptotic erythroblasts in the S + G2/M phases of cell cycle and (B) percentages of nonapoptotic erythroblasts in the G0/G1 phases of cell cycle; adherent erythroblasts (■), nonadherent erythroblasts (♦), control erythroblasts (○). Results are the means plus or minus SE of 3 separate experiments; increased adherent erythroblasts in S + G2/M and decreased adherent erythroblasts in G0/G1 compared with controls and nonadherent erythroblasts were significant at all times (*P < .007). (C) BrdU pulse-chase labeling for determination of cell cycle phases. From 6 hours to 7 hours of incubation, cocultured and control erythroblasts (EBs) were pulse-labeled with 25 μg/mL of BrdU, washed with ECM, and “chased” with normal medium. Green dots indicate BrdU-labeled erythroblasts; black dots, unlabeled erythroblasts. Incorporated BrdU was detected by fluorescein isothiocyanate-conjugated antibodies and total DNA content detected by propidium iodide staining (2N and 4N DNA content are shown on x-axes). In the experiment shown, 63% of adherent erythroblasts and 49% of control erythroblasts labeled with BrdU. The box designated R5 was constructed to demarcate the BrdU-labeled erythroblasts in G0/G1 phase of cell cycle as described in the text.
Figure 6
Figure 6
Adherent erythroblasts in cocultures have slightly delayed enucleation compared with nonadherent and control erythroblasts. Differential counts of control (■), nonadherent (▩), and adherent (▒) erythroblasts (EBs) were determined as percentages of total erythroid cell elements (erythroblasts + reticulocytes + extruded nuclei) in cultures as described under “Assessment of differentiation and enucleation.” Counts were made with (A) 44-hour cultures and (B) 72-hour cultures. Results are means plus or minus SE from 7 separate experiments; decreased enucleation of adherent erythroblasts was significant at 44 hours (*P < .001), but not at 72 hours (P = .4).
Figure 7
Figure 7
Model of erythropoiesis based on erythropoietin (EPO) suppression of erythroblast apoptosis and macrophage enhancement of erythroblast proliferation. In the CFU-E and early erythroblast stages, erythroid progenitor cells become dependent on EPO for prevention of apoptosis (EPO Dependence). Before the EPO-dependent period, the erythroid progenitors survive without EPO (Before EPO Dependence). Cells surviving transit through the EPO-dependent period (After EPO Dependence) complete one cell division and enucleate becoming reticulocytes (bottom rows of cells). EPO-dependent cells are heterogeneous, with the most dependent cells on the right side of each diagram and least dependent cells on the left. Surviving cells are indicated by intact nuclei, whereas cells undergoing apoptosis from insufficient EPO are indicated by fragmented nuclei. Although the actual number of EPO-dependent generations is unknown, 3 generations of EPO-dependent progenitors are shown for normal macrophage numbers and function (A), and 2 generations are shown for absent or decreased macrophage function (B).

References

    1. Chasis JA. Erythroblastic islands: specialized microenvironmental niches for erythropoiesis. Curr Opin Hematol. 2006;13:137–141. - PubMed
    1. Le Charpentier Y, Prenant M. [Isolation of erythroblastic islands. Study by optical and scanning electron microscopy (author's transl)]. Nouv Rev Fr Hematol. 1975;15:119–140. - PubMed
    1. Bessis M, Mize C, Prenant M. Erythropoiesis: comparison of in vivo and in vitro amplification. Blood Cells. 1978;4:155–174. - PubMed
    1. Crocker PR, Gordon S. Isolation and characterization of resident stromal macrophagesand hematopoietic cell clusters from mouse bone marrow. J Exp Med. 1985;162:993–1014. - PMC - PubMed
    1. Hanspal M, Hanspal JS. The association of erythroblasts with macrophages promotes erythroid proliferation and maturation: a 30-kD heparin-binding protein is involved in this contact. Blood. 1994;84:3494–3504. - PubMed

Publication types