. 2007 Nov;19(11):3437-50.
doi: 10.1105/tpc.107.053645. Epub 2007 Nov 9.

Riboswitch control of gene expression in plants by splicing and alternative 3' end processing of mRNAs

Affiliations

Riboswitch control of gene expression in plants by splicing and alternative 3' end processing of mRNAs

Andreas Wachter et al. Plant Cell. 2007 Nov.

Abstract

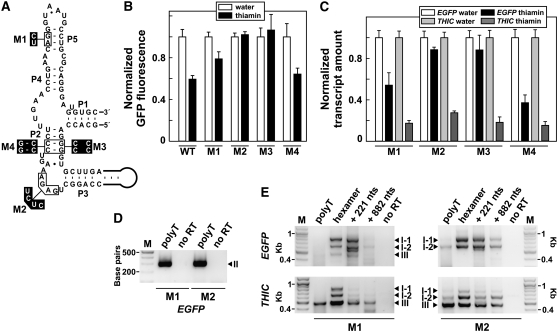
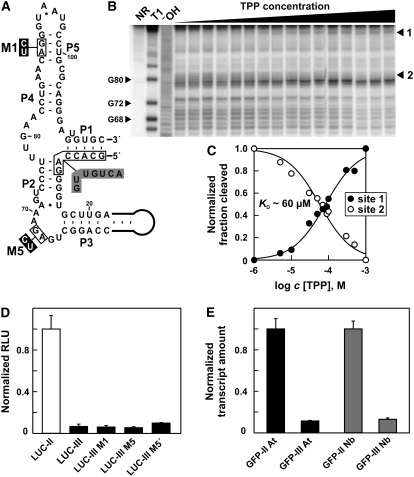
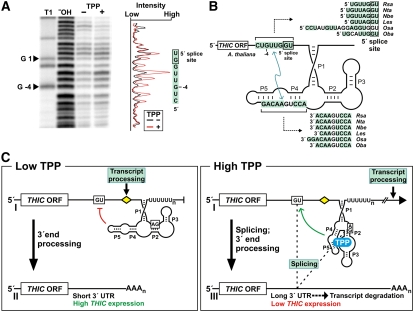
The most widespread riboswitch class, found in organisms from all three domains of life, is responsive to the vitamin B(1) derivative thiamin pyrophosphate (TPP). We have established that a TPP-sensing riboswitch is present in the 3' untranslated region (UTR) of the thiamin biosynthetic gene THIC of all plant species examined. The THIC TPP riboswitch controls the formation of transcripts with alternative 3' UTR lengths, which affect mRNA accumulation and protein production. We demonstrate that riboswitch-mediated regulation of alternative 3' end processing is critical for TPP-dependent feedback control of THIC expression. Our data reveal a mechanism whereby metabolite-dependent alteration of RNA folding controls splicing and alternative 3' end processing of mRNAs. These findings highlight the importance of metabolite sensing by riboswitches in plants and further reveal the significance of alternative 3' end processing as a mechanism of gene control in eukaryotes.


Figures

Figure 1.
Figure 1.
TPP Aptamers Are Conserved and Widespread in Plant Species. (A) Alignment of TPP aptamer sequences from various plant species reveals high conservation of sequence and structure. Nucleotides forming stems P1 through P5 are highlighted in color, and asterisks identify nucleotides that are conserved between all examples. Sequences are derived from Arabidopsis (Ath, NC003071), Raphanus sativus (Rsa, EF588038), Brassica oleracea (Bol, BH250462), Boechera stricta (Bst, DU681973), Carica papaya (Cpa, DX471004), Citrus sinensis (Csi, DY305604), Nicotiana tabacum (Nta, EF588039), Nicotiana benthamiana (Nbe, EF588040), Populus trichocarpa (Ptr, Joint Genome Initiative, Populus genome, LG_IX: 7897690-7897807), Lotus japonicus (Lja, AG247551), Lycopersicon esculentum (Les, EF588041), Solanum tuberosum (Stu, DN941010), Ocimum basilicum (Oba, EF588042), Ipomoea nil (Ini, BJ566897), Vitis vinifera (Vvi, AM442795), Oryza sativa (Osa, NC008396), Poa secunda (Pse, AF264021), Triticum aestivum (Tae, CD879967), Hordeum vulgare (Hvu, BM374959), Sorghum bicolor (Sbi, CW250951), Pinus taeda (Pta, CCGB, Contig116729 RTDS2_8_E12.g1_A021: 551-686), and Physcomitrella patens (Ppa, gnl|ti|856901678, gnl|ti|893553357, gnl|ti|876297717; Lang et al., 2005). The sequence for I. nil represents a splice variant derived from cDNA and is therefore lacking the 5′ end of the aptamer. (B) and (C) Consensus sequences and secondary structure models of TPP riboswitch aptamers based on all representatives from plants (B) or bacterial and archaeal species (C). The mutual information reflects the probability for the occurrence of the boxed base pairs (Barrick and Breaker, 2007).
Figure 2.
Figure 2.
The Exon-Intron Organization of THIC 3′ UTRs Is Conserved. (A) Organization of the 3′ region of THIC genes and derived transcript types are similar. The first box represents the last exon of the coding region with the stop codon UAA depicted. The stop codon is followed by an intron (except in L. esculentum, where the intron is located immediately in front of the stop codon), which is spliced in transcript types II and III (see [B] and [D]). GU and AG notations identify 5′ and 3′ splice sites, respectively. Arrows indicate binding sites of primers that were used for RT-PCR amplification of THIC 3′ UTRs shown in (B) to (D). Dashed lines indicate splicing events, and the diamond represents the transcript processing site. (B) PCR amplification of THIC 3′ UTRs with DNA primers a and b from cDNAs generated with polyT primer yields only type II RNAs in all species examined. RT-PCR products were separated using 1.5% agarose gel electrophoresis and visualized by ethidium bromide staining and UV illumination. M designates the marker lane containing DNAs of 100-bp increments. (C) RT-PCR analysis was conducted using the same cDNAs as used in (B) with primers a and c. Primer c is specific for 3′ UTRs of types I and III RNAs. Kbp designates kilobase pairs. (D) RT-PCR products of 3′ UTRs from type I and III RNAs from Arabidopsis cDNAs generated with different RT primers. Primers used for RT were polyT, random hexamers, or sequence-specific primers that bind near the annotated end of THIC (221 nucleotides downstream of the end of the aptamer) or further downstream (882 nucleotides downstream of the end of the aptamer) as indicated. PCR amplification was performed with primers a and c for all cDNAs. I-1 and I-2 represent type I RNAs with the upstream intron following the stop codon unspliced or spliced, respectively. No RT indicates a control reaction using the RNA without reverse transcription as a template source.
Figure 3.
Figure 3.
THIC Transcript Types Respond Differently to Changes in Thiamin Levels in Arabidopsis. (A) qRT-PCR analysis was conducted on THIC transcripts from Arabidopsis seedlings grown for 14 d on medium supplemented with 0, 0.1, and 1 mM thiamin. Total THIC transcripts and types I, II, and III RNAs were separately detected using different primer combinations. cDNAs were generated using a polyT primer or random hexamers for detection of type I RNAs. Expression was normalized for each primer combination to the value measured using medium without thiamin (open bars). Values are averages from three independent experiments, and error bars represent sd. (B) RNA gel blot analysis of THIC transcripts from the same samples described in (A). Twenty micrograms of total RNA was loaded per lane and analyzed using probes binding to the coding region of THIC, the extended 3′ UTR of types I and III RNAs, or the control transcript EIF4A1. The signal of THIC probes are shown in the size range between 2 and 3 kb. The 3′ UTR probe resulted in weak signals, and exposure time was extended to 3 d compared with 1 d of exposure for the other probes. (C) qRT-PCR analysis of the time-dependent effects of thiamin treatment on THIC transcripts from Arabidopsis. Seedlings were grown for 14 d on thiamin-free medium and subsequently sprayed with 50 μM thiamin and 0.25 mg mL−1 Tween 80. Control seedlings were treated with a solution containing only Tween 80. Samples were collected after 4 and 26 h and subjected to qRT-PCR analysis. Amounts of THIC transcripts were analyzed from cDNAs generated with polyT primer and normalized to the values of the control samples without application of thiamin (open bars). Values are averages from three independent experiments, and error bars represent sd. (D) Relative changes of the levels of THIC transcript types in wild-type and TPK-KO Arabidopsis plants. Seedlings were grown for 12 d on thiamin-free medium, and amounts of THIC transcript types were analyzed by qRT-PCR. Data were normalized to the values for the wild-type samples and reflect averages from three replicates, with error bars representing sd.
Figure 4.
Figure 4.
In Vivo Analysis of Riboswitch Function. (A) Leaves from stably transformed Arabidopsis lines expressing a reporter fusion of the complete 3′ region of AtTHIC fused to the 3′ end of EGFP were abscised and incubated with the petioles in water or in water supplemented with 0.02% thiamin. EGFP fluorescence was assessed at 0, 48, and 72 h after onset of treatment. One representative set of data from three repeats is shown, and the numbers identify different leaves from one transgenic line. (B) Quantitation of EGFP fluorescence of leaves depicted in (A) at three time points. The data represent average fluorescence intensity and sd for each leaf. The plot also depicts average background fluorescence of wild-type leaves. (C) qRT-PCR analysis of total EGFP and THIC transcripts from leaves incubated for 72 h in water or 0.02% thiamin. Transcript amounts were standardized to an internal reference transcript and normalized to transcript abundance in water-treated samples. Values are averages from four independent experiments using different transgenic lines, and error bars represent sd. (D) and (E) RT-PCR analysis of different 3′ UTRs of EGFP and THIC transcript types from Arabidopsis reporter transformants grown in the absence of exogenous thiamin. For cDNA generation, a polyT primer, random hexamers, or two different gene-specific primers (binding either 221 or 882 nucleotides downstream of the end of the aptamer) were used as indicated. The forward primers (equivalent to primer a in Figure 2A) were specific for the end of the last exon of the coding region of EGFP (left) or THIC (right), whereas the reverse primer was either a polyT primer ([D]; equivalent to primer b in Figure 2A) or homologous to a region 221 nucleotides downstream of the end of the aptamer ([E]; equivalent to primer c in Figure 2A). RT-PCR products were separated and visualized as described in the legend to Figure 2. M designates the marker lanes containing DNAs of 100-bp increments. No RT indicates a control reaction using the RNA without reverse transcription as a template source. I-1 and I-2 represent type I RNAs with the upstream intron following the stop codon unspliced or spliced, respectively. The lowest band in the polyT reaction in (E) results from amplification of THIC type II RNAs with polyT primer remaining from the RT reaction. Additional unmarked bands correspond to nonspecific amplification as confirmed by cloning and sequencing of all RT-PCR products.
Figure 5.
Figure 5.
Effects of Aptamer Mutations on Riboswitch Function. (A) Secondary structure model and sequence of the wild-type TPP aptamer from Arabidopsis located in the 3′ region of THIC that was fused to EGFP. Black boxed nucleotides were altered as indicated to generate mutants M1, M2, and M3 with impaired TPP binding and the compensatory mutant M4. (B) Quantitation of EGFP fluorescence in leaves from Arabidopsis transformants expressing reporter constructs containing the wild-type aptamer sequence or mutated versions M1, M2, M3, and M4. Leaves were excised and incubated with their petioles in water or 0.02% thiamin for 72 h before fluorescence analysis. Values are averages from at least three independent experiments using different transgenic lines. Error bars represent sd. (C) qRT-PCR analyses of EGFP and THIC transcript amounts in Arabidopsis transformants. Thiamin treatment was performed as described in (B). Transcript amounts (standardized using a reference transcript) were normalized to transcript abundance in water-treated samples. Values are averages from two to four independent experiments using different transgenic lines. Error bars represent sd. (D) and (E) RT-PCR analyses of 3′ UTRs of EGFP and THIC transcripts from Arabidopsis transformants with mutations M1 or M2. RT-PCR analyses were performed as described in the legends to Figures 4D and 4E. Forward primers were homologous to the end of the last exon of the coding region of EGFP or THIC, and the reverse primer was a polyT primer (D) or complementary to a region 221 nucleotides downstream of the end of the aptamer (E). Kbp designates kilobase pairs.
Figure 6.
Figure 6.
The Long 3′ UTR of THIC Causes Reduced Gene Expression Independent of Aptamer Function. (A) Secondary structure model of the TPP aptamer generated after splicing in THIC type III RNA from Arabidopsis. Gray shaded nucleotides in stems P1 and P2 identify nucleobase changes compared with the original unspliced aptamer. Black boxed nucleotides were altered as shown to generate mutants M1 and M5 that do not bind TPP. (B) In-line probing analysis of TPP binding by the spliced aptamer depicted in (A). Lanes include RNAs loaded after no reaction (NR), after partial digestion with RNase T1 (T1), or after partial digestion with alkali (OH). Sites 1 and 2 were quantified to establish the Kd as shown in (C). (C) Plot indicating the normalized fraction of RNA spontaneously cleaved versus the concentration of TPP for sites 1 and 2 in (B). (D) In vivo expression analysis of reporter constructs containing the 3′ UTR of Arabidopsis type II or III RNAs fused to the 3′ end of the coding region of firefly luciferase (LUC). Constructs M1 and M5 are based on the 3′ UTR of type III RNAs but contain the mutations shown in (A). LUC-III M5′ contains the inverted 3′ UTR sequence of construct LUC-III M5. Reporter constructs were analyzed in a transient N. benthamiana expression assay and values standardized to a coexpressed luciferase gene from Renilla. Expression was normalized to the fusion construct containing the 3′ UTR of type II RNA. Data shown are mean values of three independent experiments, and the error bars represent sd. (E) qRT-PCR analysis of EGFP reporter fusions that contain the 3′ UTRs of THIC type II or III RNAs from either Arabidopsis (At) or N. benthamiana (Nb) after expression in a transient expression assay. Expression was standardized to a coexpressed DsRED reporter gene and normalized to the constructs containing a type II 3′ UTR. Data shown are mean values of two representative experiments, and the error bars reflect sd.
Figure 7.
Figure 7.
Mechanism of Riboswitch Function in Plants. (A) TPP causes changes in RNA structure near to the 5′ splice site, which is important for the formation of THIC type III RNA. For in-line probing, a 5′ 32P-labeled RNA starting 14 nucleotides upstream of the 5′ splice site (+1) and extending to the 3′ end of the TPP aptamer (nucleotides −14 to 261) from Arabidopsis was incubated in the absence (–) or presence (+) of 10 μM TPP, and the resulting spontaneous cleavage products were separated by PAGE. Markers are RNAs partially digested with RNase T1 (T1) or alkali (OH). The graph depicts the relative band intensities in the lanes indicated. (B) Base-pairing potential between the 5′ splice site region and the P4-P5 stems of the TPP aptamer from Arabidopsis (complementary nucleotides are shaded). Stretches of complementary nucleotides are also present in all other plant THIC mRNA sequences available. (C) A model for THIC TPP riboswitch function in plants includes control of splicing and alternative 3′ end processing of transcripts. When TPP concentrations are low (left), portions of stems P4 and P5 interact with the 5′ splice site and thereby prevent splicing. The transcript processing site located between the 5′ splice site and the TPP aptamer is retained, and its use results in formation of transcripts with short 3′ UTRs that permit high expression. In the presence of elevated TPP concentrations (right), TPP binds to the aptamer cotranscriptionally, which leads to a structural change that prevents interaction with the 5′ splice site. Splicing occurs and removes the transcript processing site. Transcription continues and alternative processing sites in the extended 3′ UTR give rise to THIC type III RNAs. The long 3′ UTRs lead to increased RNA turnover, causing reduced expression of THIC.

Similar articles

Cited by

References

    1. Abreu-Goodger, C., and Merino, E. (2005). RibEx: A web server for locating riboswitches and other conserved bacterial regulatory elements. Nucleic Acids Res. 33 W690–692. - PMC - PubMed
    1. Barrick, J.E., and Breaker, R.R. (2007). The distributions, mechanisms, and structures of metabolite-binding riboswitches. Genome Biol., in press. - PMC - PubMed
    1. Barrick, J.E., Corbino, K.A., Winkler, W.C., Nahvi, A., Mandal, M., Collins, J., Lee, M., Roth, A., Sudarsan, N., Jona, I., Wickiser, J.K., and Breaker, R.R. (2004). New RNA motifs suggest an expanded scope for riboswitches in bacterial genetic control. Proc. Natl. Acad. Sci. USA 101 6421–6426. - PMC - PubMed
    1. Batey, R.T., Gilbert, S.D., and Montange, R.K. (2004). Structure of a natural guanine-responsive riboswitch complexed with the metabolite hypoxanthine. Nature 432 411–415. - PubMed
    1. Cazzonelli, C.I., and Velten, J. (2006). An in vivo, luciferase-based, Agrobacterium-infiltration assay system: Implications for post-transcriptional gene silencing. Planta 224 582–597. - PubMed

Publication types

MeSH terms