

Defining cortical frequency tuning with recurrent excitatory circuitry
- PMID: 17994013
- PMCID: PMC2447868
- DOI: 10.1038/nn2012
Defining cortical frequency tuning with recurrent excitatory circuitry
Abstract
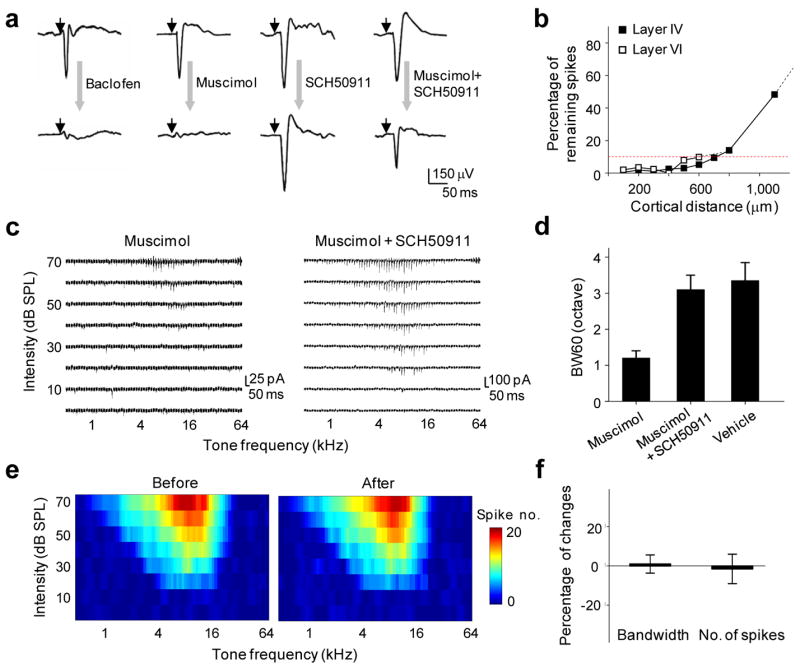
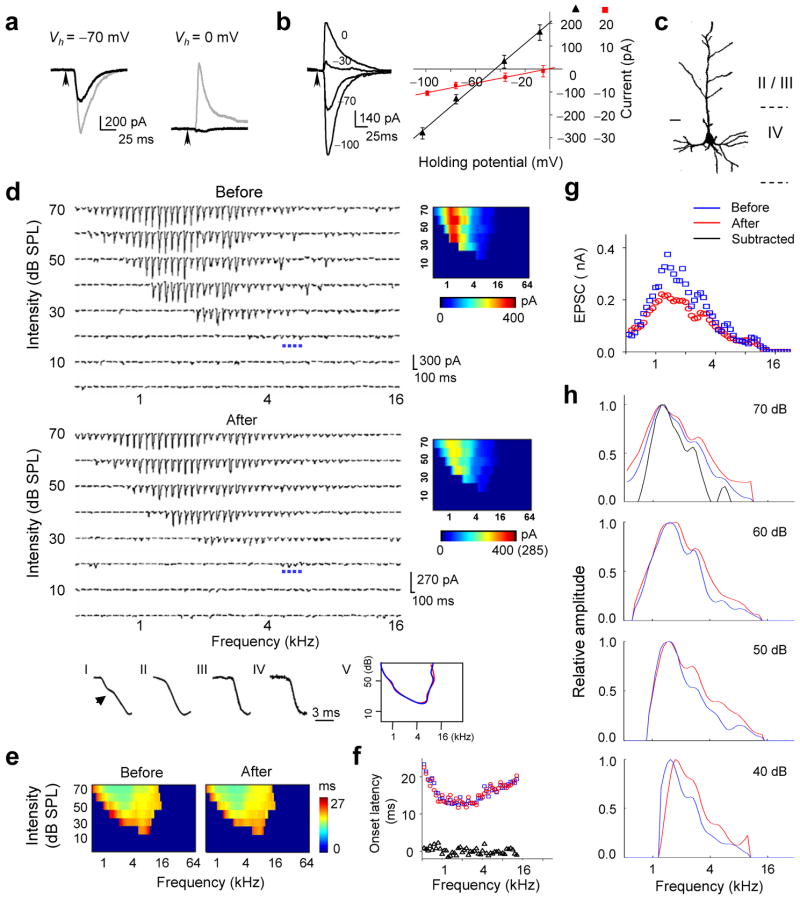
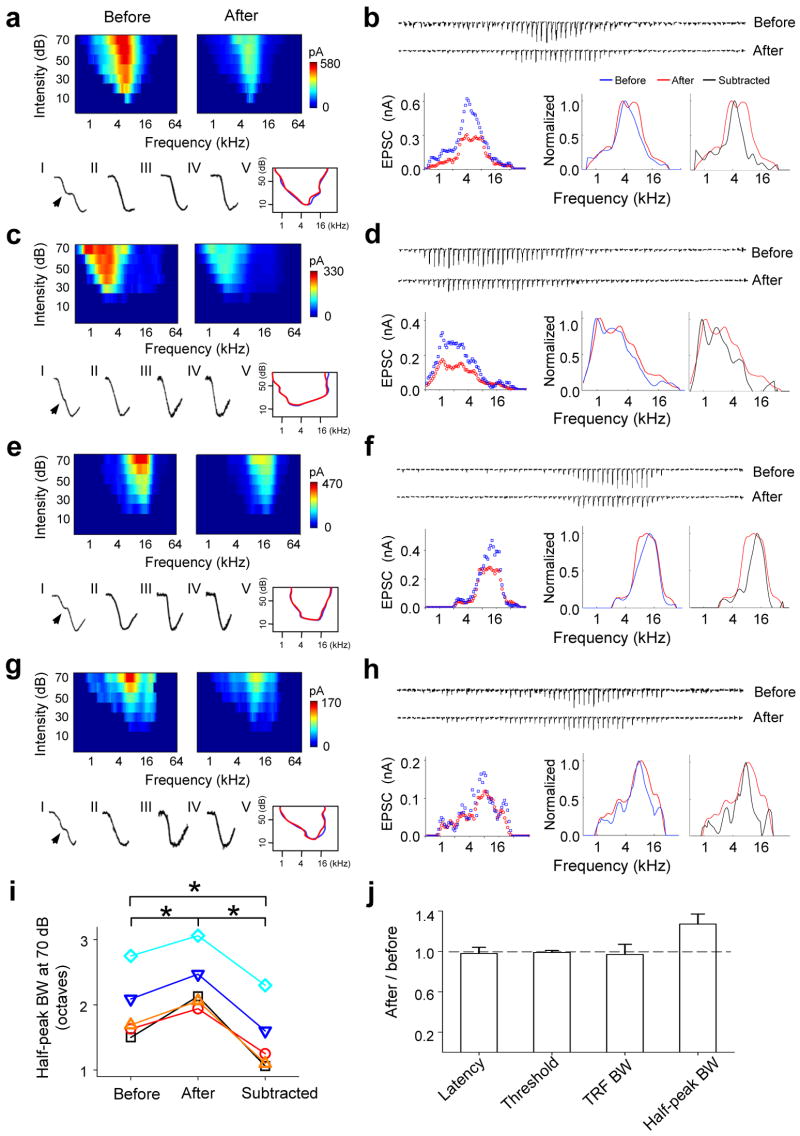
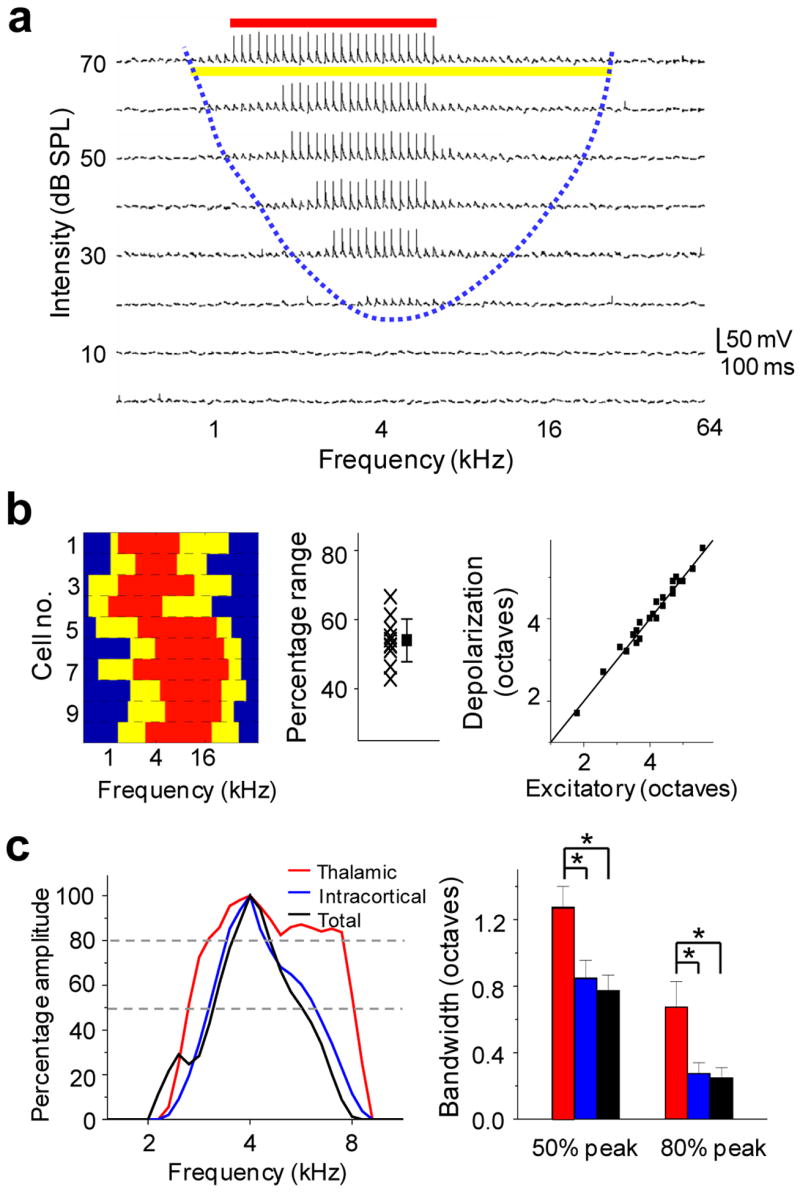
Neurons in the recipient layers of sensory cortices receive excitatory input from two major sources: the feedforward thalamocortical and recurrent intracortical inputs. To address their respective functional roles, we developed a new method for silencing cortex by competitively activating GABA(A) while blocking GABA(B) receptors. In the rat primary auditory cortex, in vivo whole-cell recording from the same neuron before and after local cortical silencing revealed that thalamic input occupied the same area of frequency-intensity tonal receptive field as the total excitatory input, but showed a flattened tuning curve. In contrast, excitatory intracortical input was sharply tuned with a tuning curve that closely matched that of suprathreshold responses. This can be attributed to a selective amplification of cortical cells' responses at preferred frequencies by intracortical inputs from similarly tuned neurons. Thus, weakly tuned thalamocortical inputs determine the subthreshold responding range, whereas intracortical inputs largely define the tuning. Such circuits may ensure a faithful conveyance of sensory information.
Figures
Similar articles
-
Selective Strengthening of Intracortical Excitatory Input Leads to Receptive Field Refinement during Auditory Cortical Development.J Neurosci. 2019 Feb 13;39(7):1195-1205. doi: 10.1523/JNEUROSCI.2492-18.2018. Epub 2018 Dec 26. J Neurosci. 2019. PMID: 30587538 Free PMC article.
-
Fine-tuning of pre-balanced excitation and inhibition during auditory cortical development.Nature. 2010 Jun 17;465(7300):927-31. doi: 10.1038/nature09079. Nature. 2010. PMID: 20559386 Free PMC article.
-
Preceding inhibition silences layer 6 neurons in auditory cortex.Neuron. 2010 Mar 11;65(5):706-17. doi: 10.1016/j.neuron.2010.02.021. Neuron. 2010. PMID: 20223205 Free PMC article.
-
Synaptic mechanisms underlying functional dichotomy between intrinsic-bursting and regular-spiking neurons in auditory cortical layer 5.J Neurosci. 2013 Mar 20;33(12):5326-39. doi: 10.1523/JNEUROSCI.4810-12.2013. J Neurosci. 2013. PMID: 23516297 Free PMC article.
-
Synaptic mechanisms underlying auditory processing.Curr Opin Neurobiol. 2006 Aug;16(4):371-6. doi: 10.1016/j.conb.2006.06.015. Epub 2006 Jul 13. Curr Opin Neurobiol. 2006. PMID: 16842988 Review.
Cited by
-
Spatial Asymmetry and Short-Term Suppression Underlie Direction Selectivity of Synaptic Excitation in the Mouse Visual Cortex.Cereb Cortex. 2018 Jun 1;28(6):2059-2070. doi: 10.1093/cercor/bhx111. Cereb Cortex. 2018. PMID: 28498898 Free PMC article.
-
The synaptic representation of sound source location in auditory cortex.J Neurosci. 2009 Nov 11;29(45):14127-35. doi: 10.1523/JNEUROSCI.2061-09.2009. J Neurosci. 2009. PMID: 19906961 Free PMC article.
-
Schizophrenia from a neural circuitry perspective: advancing toward rational pharmacological therapies.J Clin Invest. 2009 Apr;119(4):706-16. doi: 10.1172/JCI37335. Epub 2009 Apr 1. J Clin Invest. 2009. PMID: 19339762 Free PMC article. Review.
-
GABAergic neural activity involved in salicylate-induced auditory cortex gain enhancement.Neuroscience. 2011 Aug 25;189:187-98. doi: 10.1016/j.neuroscience.2011.04.073. Epub 2011 Jun 12. Neuroscience. 2011. PMID: 21664433 Free PMC article.
-
A major role for intracortical circuits in the strength and tuning of odor-evoked excitation in olfactory cortex.Neuron. 2011 Oct 6;72(1):41-8. doi: 10.1016/j.neuron.2011.08.015. Neuron. 2011. PMID: 21982367 Free PMC article.
References
-
- Reid RC, Alonso JM. Specificity of monosynaptic connections from thalamus to visual cortex. Nature. 1995;378:281–284. - PubMed
-
- Ferster D, Chung S, Wheat H. Orientation selectivity of thalamic input to simple cells of cat visual cortex. Nature. 1996;380:249–252. - PubMed
-
- Chung S, Ferster D. Strength and orientation tuning of the thalamic input to simple cells revealed by electrically evoked cortical suppression. Neuron. 1998;20:1177–1189. - PubMed
-
- Miller LM, Escabi MA, Read HL, Schreiner CE. Functional convergence of response properties in the auditory thalamocortical system. Neuron. 2001;32:151–160. - PubMed
-
- Bruno RM, Sakmann B. Cortex is driven by weak but synchronously active thalamocortical synapses. Science. 2006;312:1622–1627. - PubMed
Publication types
MeSH terms
Substances
Grants and funding
LinkOut - more resources
Full Text Sources
