. 2007 Dec;39(12):1507-11.
doi: 10.1038/ng.2007.21. Epub 2007 Nov 11.

RNA polymerase is poised for activation across the genome

Affiliations

RNA polymerase is poised for activation across the genome

Ginger W Muse et al. Nat Genet. 2007 Dec.

Abstract

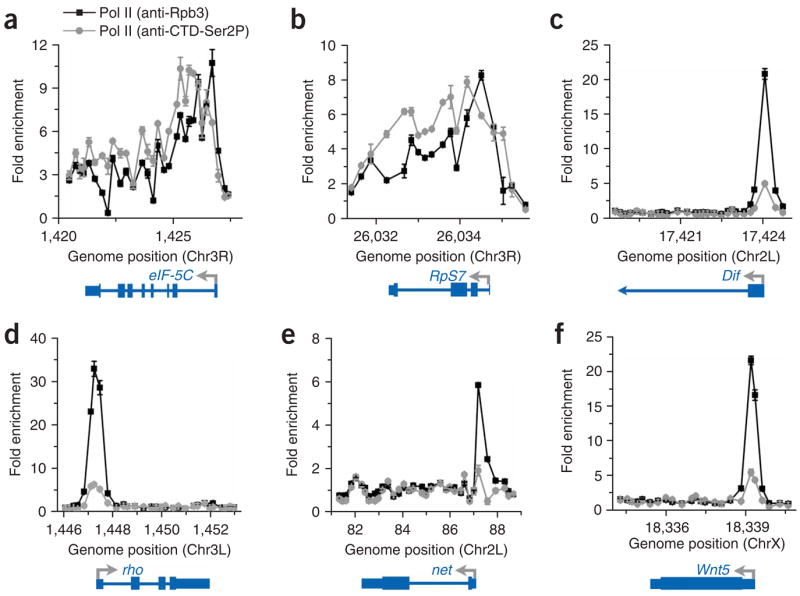
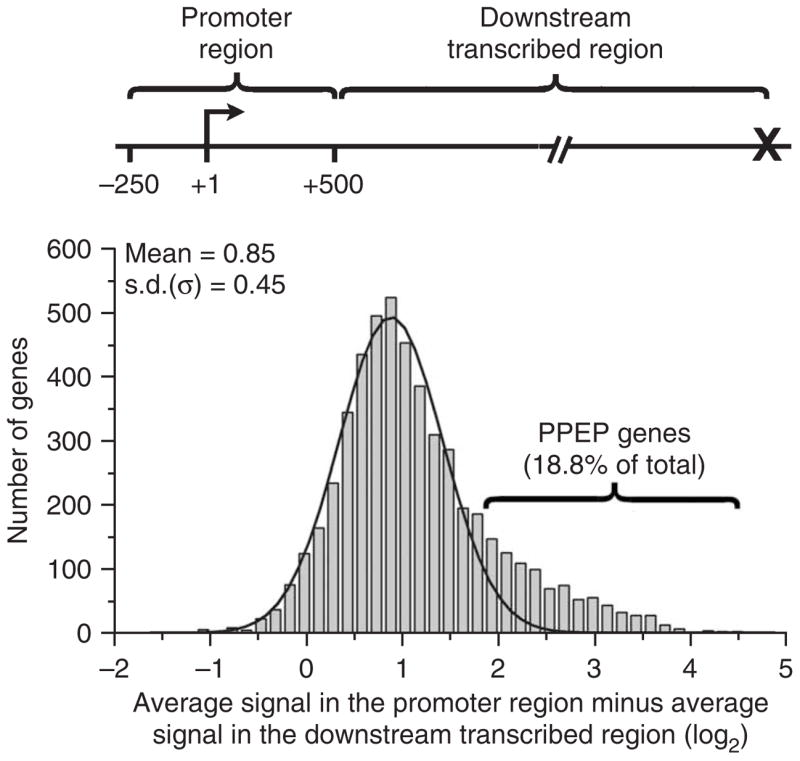
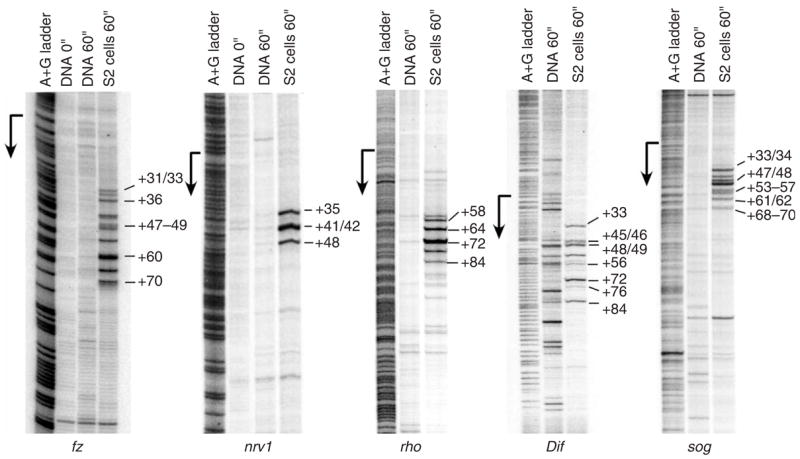
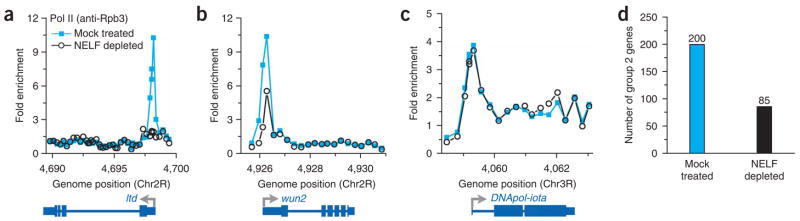
Regulation of gene expression is integral to the development and survival of all organisms. Transcription begins with the assembly of a pre-initiation complex at the gene promoter, followed by initiation of RNA synthesis and the transition to productive elongation. In many cases, recruitment of RNA polymerase II (Pol II) to a promoter is necessary and sufficient for activation of genes. However, there are a few notable exceptions to this paradigm, including heat shock genes and several proto-oncogenes, whose expression is attenuated by regulated stalling of polymerase elongation within the promoter-proximal region. To determine the importance of polymerase stalling for transcription regulation, we carried out a genome-wide search for Drosophila melanogaster genes with Pol II stalled within the promoter-proximal region. Our data show that stalling is widespread, occurring at hundreds of genes that respond to stimuli and developmental signals. This finding indicates a role for regulation of polymerase elongation in the transcriptional responses to dynamic environmental and developmental cues.


Figures

Figure 1
Figure 1
Whole-genome mapping of Pol II binding in Drosophila S2 cells. (a) Top, percentage of input DNA obtained by ChIP (n = 3; error bars, s.d.) versus chromosome position (in kilobase units), which represents the center point between primers used for quantitative PCR. Bottom, fold enrichment over genomic DNA observed by ChIP-chip (n = 2; error shows range, which is too small to be seen at some data points) versus chromosome position of probes. Relative probe intensities from Pol II ChIP-chip are shown in grayscale (black, higher intensity; white, lower intensity); below, arrows within genes denote the direction of transcription. (b) Flowchart describing the strategy used to determine and validate global Pol II promoter occupancy. (c) A histogram showing the position of the maximally bound probe within each bound gene (n = 5,403) with respect to the transcription start site (TSS).
Figure 2
Figure 2
Pol II is enriched near the promoters of a subset of genes. ChIP-chip data for Pol II using antibodies that recognize the Rpb3 subunit (black squares) and the serine-2-phosphorylated CTD of Rpb1 (gray circles) are shown for six bound genes, plotted as fold enrichment over input versus chromosome position in kilobase units. The start site and direction of transcription are shown by arrows, with boxes depicting exons and lines representing introns. (a) eIF-5c (CG2922-RA). (b) RpS7 (CG1883-RA). (c) Dif (CG6794-RA). (d) rho (CG1004-RA). (e) net (CG11450-RA). (f) Wnt5 (CG6407-RA).
Figure 3
Figure 3
A subset of genes possess much more Pol II near their promoters than in the downstream region. The difference in average signal intensity (log2) in the promoter region (from −250 to +500 bp with respect to the transcription start site) and the downstream transcribed region (from +501 bp to the site of transcription termination) was determined. Shown is a histogram of these values for all bound genes, fit by a single Gaussian distribution. Calculating the difference between the average signals in log base 2 units is the equivalent of determining the ratio of fold enrichment in these regions; thus, a value of 1 on the x axis represents a twofold greater average Pol II signal near the promoter than downstream. A bracket designates the 1,014 genes with values >2 s.d. above the mean. These genes are defined as having promoter-proximal enrichment of polymerase (PPEP).
Figure 4
Figure 4
Permanganate mapping of open transcription bubbles reveals engaged Pol II within the promoter-proximal region of genes with PPEP. In vivo permanganate footprinting demonstrates the presence and locations of engaged Pol II in the promoter-proximal region of five genes with PPEP. Each panel shows a adenine-guanine ladder used for position determination, the reactivity pattern of naked DNA as a control and the permanganate reactivity observed in S2 cells (last lane in each panel). The positions of a subset of hyper-reactive thymine residues are identified to the right of each panel.
Figure 5
Figure 5
Depletion of NELF relieves promoter-proximal stalling, globally reducing PPEP. (ac) Pol II (anti-Rpb3) ChIP-chip data from NELF-depleted (open circles) and mock-treated ChIP samples (blue squares) for genes with PPEP, ltd (CG8024-RC) (a) and wun2 (CG8805-RC) (b) as well as for a gene with more uniform Pol II signal, DNA Pol II-iota (CG7602-RB) (c). (d) Number of genes with PPEP observed on our partial ChIP-chip arrays in mock-treated and NELF-depleted Drosophila S2 cells.
Figure 6
Figure 6
Gene ontology analysis shows that genes with PPEP are enriched in genes involved in development, reproduction and the response to stimulus. (a) Query of the Gene Ontology database with a list of 1,014 genes with PPEP reveals major biological processes that were significantly overrepresented on this gene list (at a P value cutoff < 0.001). Shown are the number of genes in each Gene Ontology class, the percentage of total genes within each class that have PPEP and the associated P value. (b) Pol II (anti-Rpb3) ChIP data from three UV-inducible genes with PPEP and eIF-5c as a control, comparing Pol II distribution under uninduced and induced conditions (120 mJ/cm2 UV exposure followed by a 4-h recovery). After UV irradiation, the ratio of Pol II occupancy detected at the promoter versus downstream primer pair decreases substantially (from a ratio of 13.6 to 4.0 for W, from 16.5 to 7.7 for Hsp70 and from 4.9 to 2.1 for CG12171). n = 2 independent ChIP samples; error bars represent the range. (c) In vivo permanganate footprinting of W and CG12171 before and after UV induction, shown as in Figure 4.

Comment in

Similar articles

Cited by

References

    1. Roeder RG. Transcriptional regulation and the role of diverse coactivators in animal cells. FEBS Lett. 2005;579:909–915. - PubMed
    1. Luse DS, Samkurashvili I. The transition from initiation to elongation by RNA polymerase II. Cold Spring Harb Symp Quant Biol. 1998;63:289–300. - PubMed
    1. Shilatifard A, Conaway RC, Conaway JW. The RNA polymerase II elongation complex. Annu Rev Biochem. 2003;72:693–715. - PubMed
    1. Sims RJ, III, Belotserkovskaya R, Reinberg D. Elongation by RNA polymerase II: the short and long of it. Genes Dev. 2004;18:2437–2468. - PubMed
    1. Aida M, et al. Transcriptional pausing caused by NELF plays a dual role in regulating immediate-early expression of the junB gene. Mol Cell Biol. 2006;26:6094–6104. - PMC - PubMed

Publication types

Substances

Associated data