Review
. 2007 Sep-Oct;12(5):051402.
doi: 10.1117/1.2789693.

Optical brain imaging in vivo: techniques and applications from animal to man

Affiliations
Review

Optical brain imaging in vivo: techniques and applications from animal to man

Elizabeth M C Hillman. J Biomed Opt. 2007 Sep-Oct.

Abstract

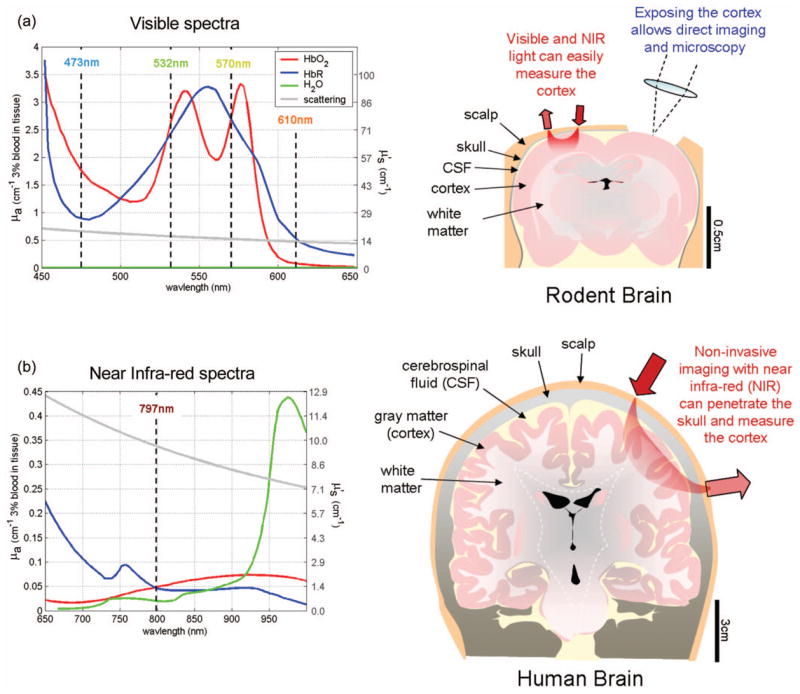
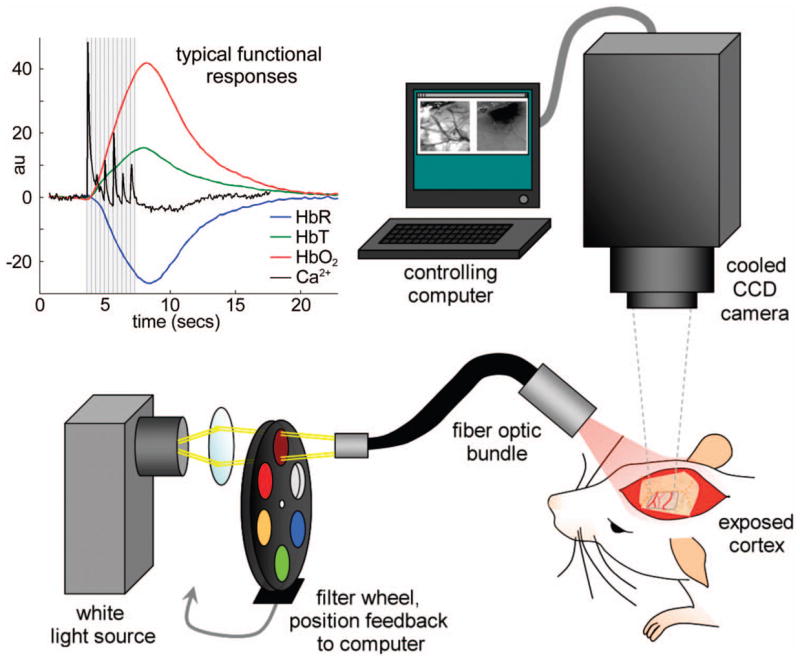
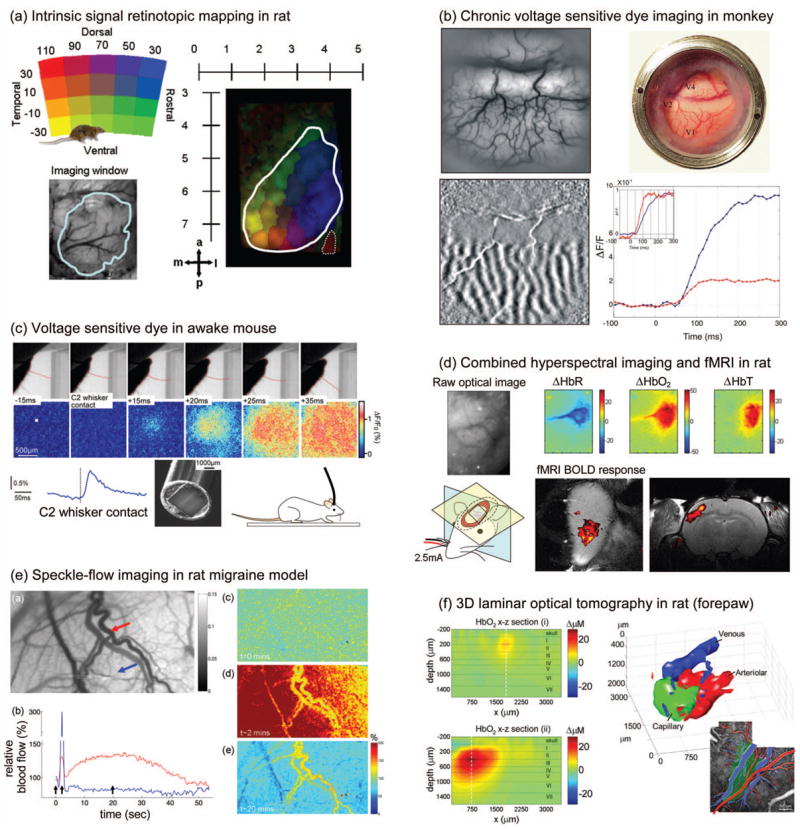
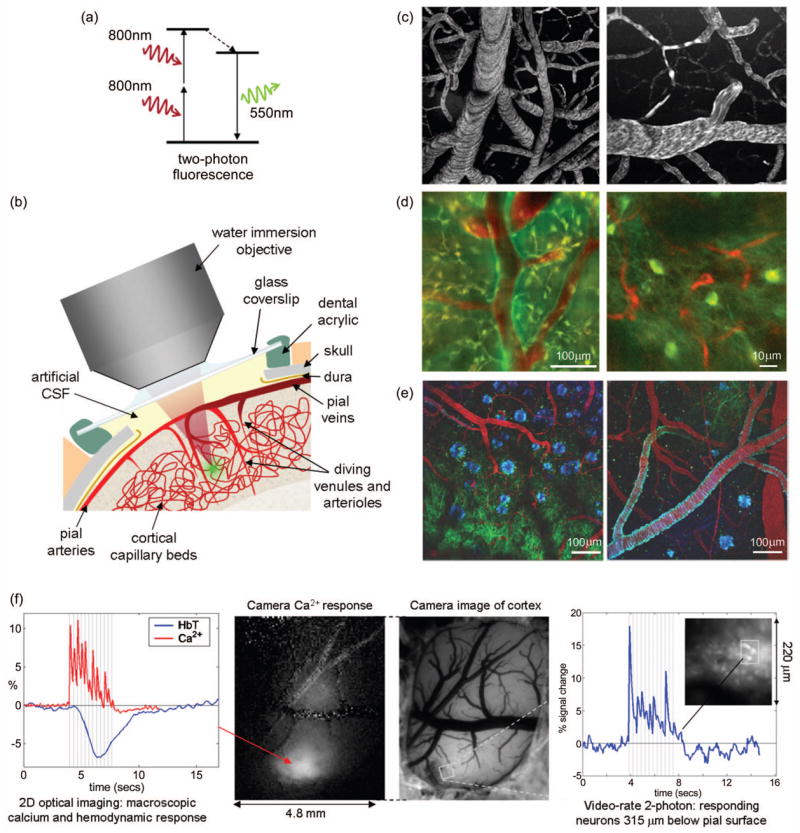
Optical brain imaging has seen 30 years of intense development, and has grown into a rich and diverse field. In-vivo imaging using light provides unprecedented sensitivity to functional changes through intrinsic contrast, and is rapidly exploiting the growing availability of exogenous optical contrast agents. Light can be used to image microscopic structure and function in vivo in exposed animal brain, while also allowing noninvasive imaging of hemodynamics and metabolism in a clinical setting. This work presents an overview of the wide range of approaches currently being applied to in-vivo optical brain imaging, from animal to man. Techniques include multispectral optical imaging, voltage sensitive dye imaging and speckle-flow imaging of exposed cortex, in-vivo two-photon microscopy of the living brain, and the broad range of noninvasive topography and tomography approaches to near-infrared imaging of the human brain. The basic principles of each technique are described, followed by examples of current applications to cutting-edge neuroscience research. In summary, it is shown that optical brain imaging continues to grow and evolve, embracing new technologies and advancing to address ever more complex and important neuroscience questions.


Figures

Fig. 1
Fig. 1
Intrinsic chromophores and structures of the brain. (a) For small animal imaging, it is possible to use visible light to look at oxygenation-dependent hemoglobin absorption (as well as exogenous absorbing and fluorescing dyes). The cortex can be exposed and imaged at high resolution, or imaged through the intact skull and scalp at lower resolution. (b) For human brain imaging, near-infrared light will penetrate more readily through the scalp and skull to sample the brain thanks to lower scatter and absorption. The human brain has a more complex convoluted structure compared to lower mammals. Spectra: major chromophores in brain are oxy- and deoxyhemoglobin and water (lipid is omitted here). For generation of these spectra: water content is assumed to be 90% (quoted value in newborn brain, 71 to 85% in adult brain34). Hemoglobin absorption is shown assuming 2-mM concentration of hemoglobin in blood and 3% content of blood in tissue (60 mM in tissue34) calculated from spectra. HbR spectrum represents 3% fully deoxygenated blood in tissue. Scatter spectrum is approximate using: μ’s=Aλb, where A=1.14 × 10⁻⁷ m and b=1.3.
Fig. 2
Fig. 2
A typical setup for camera-based imaging of the exposed cortex. Inset shows typical hemodynamic and calcium-sensitive responses in rat somatosensory cortex to ~1-mA forepaw stimulus delivered in 3 msec pulses at 3 Hz for 4 sec.
Fig. 3
Fig. 3
Examples of in-vivo exposed cortex imaging. (a) Visual stimuli were presented in different parts of a rat’s field of view, and the corresponding cortical hemodynamic HbT responses were mapped (color code indicates corresponding location of visual stimulus). Reproduced with permission from Gias et al. (b) A cranial window was implanted to allow direct imaging of primate visual cortex. A baseline image of the exposed brain is shown above an intrinsic signal ocular dominance map, acquired by subtracting the response from visual stimulus to the right eye from the left eye. Chronic VSD imaging was also performed, and ocular dominance maps closely resembled intrinsic signals. Time courses of the voltage-sensitive signal (red) showed a more prompt onset that the hemodynamic response (blue). Reproduced with permission from Slovin et al. (c) An optical fiber bundle was used to image the exposed, VSD stained cortex of an awake mouse while it explored its surroundings. Image series shows the mouse’s whisker gradually brushing against an obstacle and the corresponding cortical response. Reproduced with permission from Férézou et al. (d) A fiber optic bundle was used to image the exposed cortex of a rat undergoing electrical whisker stimulation during simultaneous acquisition of fMRI at 4.7 T. The hemodynamic response shows localized cortical changes in HbR, HbO2, and HbT, which correspond well to oblique-slice fMRI BOLD response (study by Hillman, Devor, DeCrespigny and D’Arceuil). (e) Baseline speckle contrast image showing higher flow as darker contrast and strongly accentuated vessels. Image series from top to bottom show flow prior to induction of spreading depression, 2 min after which a wave of cortical flow increase moves across the field of view, and 20 min after, when hyperperfusion in the dural vessels is prominent. Plot shows time course of flow for region of interest in cortex (blue) and dural vessel (red). Reproduced with permission from Bolay et al. (f) (left) Cross sectional x-z images through the cortical HbO2 response to a 4-sec forepaw stimulus in rat imaged using laminar optical tomography, (top) transecting a superficial vein, and (bottom) transecting the deeper capillary response. (right) 3-D rendering of arterial, capillary, and venous compartment hemodynamic responses. Ex-vivo two-photon microscopy of vasculature (inset) agrees with compartment discrimination. Reproduced with permission from Hillman et al.
Fig. 4
Fig. 4
Two-photon microscopy of in-vivo brain function. (a) Basic mechanism of two-photon fluorescence. (b) Schematic of surgical preparation of exposed cortex, with sealed glass window and microscope objective positioning. Green dot shows location of two-photon fluorescence. (c) Examples of two-photon maps of the vasculature following intravenous injection of dextran-conjugated fluorescein. Black dots and stripes show red blood cell motion. (d) Dual-channel imaging of neuronal (green) and vascular (red) signals: (left) Oregon Green 488 BAPTA-1 AM calcium-sensitive dye stained neurons and (right) transgenic mouse expressing green fluorescent protein (GFP) in a subpopulation of neurons (mouse supplied by Friedman, Rockefeller University, New York130). Texas dextran red is the intravascular tracer in both cases (studies by Hillman, Bouchard, Ruvinskaya and Boas). (e) Three-channel imaging of Tg2576 APP Alzheimer’s disease mouse model with amyloid-β targeting dye (blue), GFP expressing neurons and dendrites (green), and vasculature (red). Reproduced with permission from Spires et al. (f) 2-D camera-based imaging of hemodynamics and calcium response followed by functional two-photon imaging of the calcium response on the scale of single neurons in the same rat. Oregon Green 488 BAPTA-1 AM was loaded with serial pressure injections into the cortex. Stimulus was ~1 mA, 3-μs pulses at 3 Hz for 4 sec (studies by Hillman, Bouchard, Ruvinskaya and Boas).
Fig. 5
Fig. 5
Configurations for noninvasive optical brain imaging. (a) and (b) Functional topography uses one or more source-detector pairs to create a pseudo-2-D map of the underlying cortex. Sources and detectors may be optical fibers, or light emitting diodes and photodetectors placed directly on the skin. (c) and (d) Tomography places sources and detectors over the volume of the head, and detects light that has traveled through many projections. This approach allows subsequent reconstruction of the optical properties of the entire brain. (e) The main functional areas of the human cortex. (f) Simulation of the sensitivity of a noninvasive topographic measurement between a source and detector. The simulation used Monte-Carlo modeling and accounted for the heterogeneous 3-D structures of the adult scalp and cortex. Reproduced with permission from Boas et al.
Fig. 6
Fig. 6
Time-domain, frequency-domain, and continuous wave measurement sensitivities to absorption and scatter. Schematic shows simplistically how absorbing and scattering structures will change TD and FD data, but that in transmission, their effect on cw data will be indistinguishable.
Fig. 7
Fig. 7
Examples of noninvasive optical imaging of functional responses in humans. (a) Direct functional topography images and time courses acquired for two different motor/somatosensory stimulus paradigms on one subject. A localized HbO2 and HbR response is seen in the opposite (contralateral) side of the brain to the hand being stimulated. Reproduced with permission from Franceschini et al. (b) Functional topography measurements on adult head during fMRI. Both the spatial and temporal characteristics of the responses can be compared between two modalities. Reproduced with permission from Huppert et al. (c) Black and white visual stimuli were presented to the left and right fields of vision. The hemodynamic response was measured using a dense topographic array of sources and detectors. Data were reconstructed using a linear perturbation model. Reproduced with permission from Culver et al. (d) Time-resolved 3-D tomography data were acquired on a 33-week gestation infant undergoing passive motor stimulus to the left arm. Image series shows successive slices through 3-D head from left ear to right ear. Reproduced with permission from Gibson et al.

References

    1. Jöbsis FF. Non invasive, infrared monitoring of cerebral and myocardial oxygen sufficiency and circulatory parameters. Science. 1977;198:1264–1267. - PubMed
    1. Shoham D, Glaser DE, Arieli A, Kenet T, Wijnbergen C, Toledo Y, Hildesheim R, Grinvald A. Imaging cortical dynamics at high spatial and temporal resolution with novel blue voltage-sensitive dyes. Neuron. 1999;24:791–802. - PubMed
    1. Ohki K, Chung S, Ch’ng YH, Kara P, Reid RC. Functional imaging with cellular resolution reveals precise micro-architecture in visual cortex. Nature (London) 2005;433:597–603. - PubMed
    1. Kotlikoff MI. Genetically encoded Ca2+ indicators: using genetics and molecular design to understand complex physiology. J Physiol (London) 2007;578(Pt 1):55–67. - PMC - PubMed
    1. Klunk WE, Bacskai BJ, Mathis CA, Kajdasz ST, Frosch MP, Debnath ML, Holt DP, Wang Y, Hyman BT. Imaging Aβ plaques in living transgenic mice with multiphoton microscopy and methoxy-X04, a systemically administered Congo red derivative. J Neuropathol Exp Neurol. 2002;61(9):797–805. - PubMed

Publication types

MeSH terms