. 2007 Sep-Oct;12(5):051604.
doi: 10.1117/1.2801718.

Using noninvasive multispectral imaging to quantitatively assess tissue vasculature

Affiliations

Using noninvasive multispectral imaging to quantitatively assess tissue vasculature

Abby Vogel et al. J Biomed Opt. 2007 Sep-Oct.

Abstract

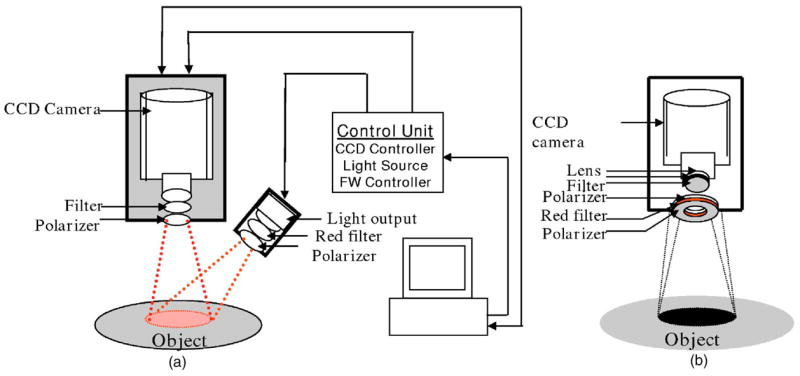
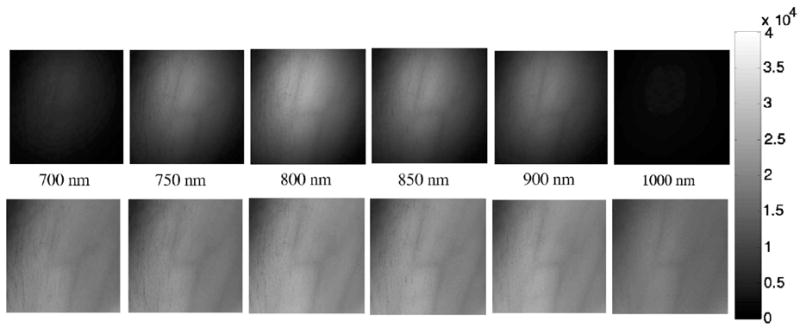
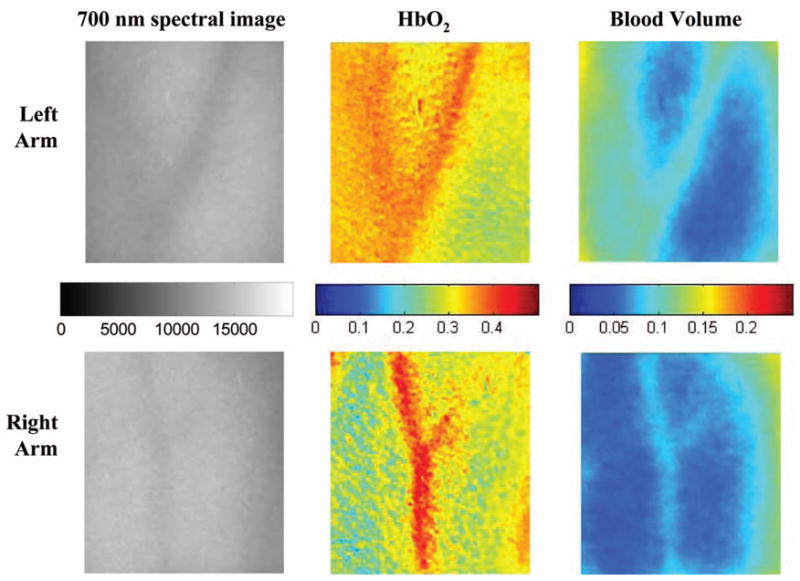
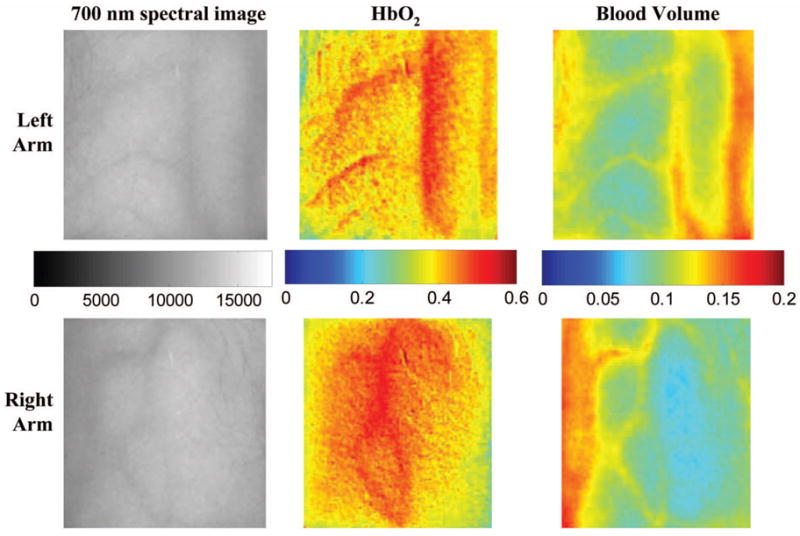
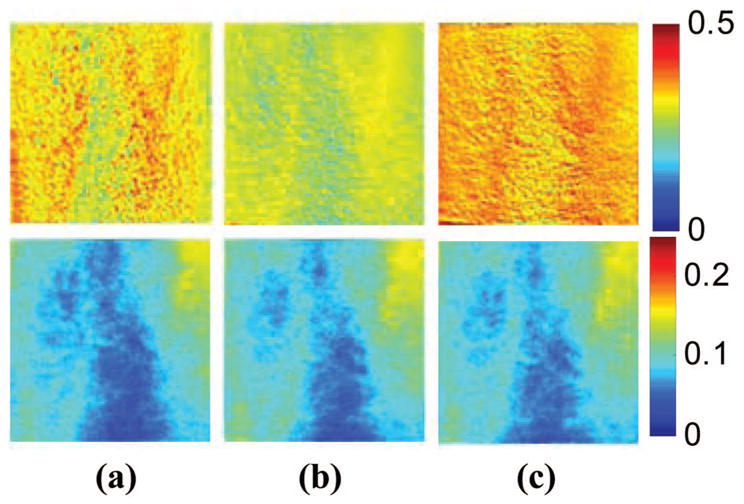
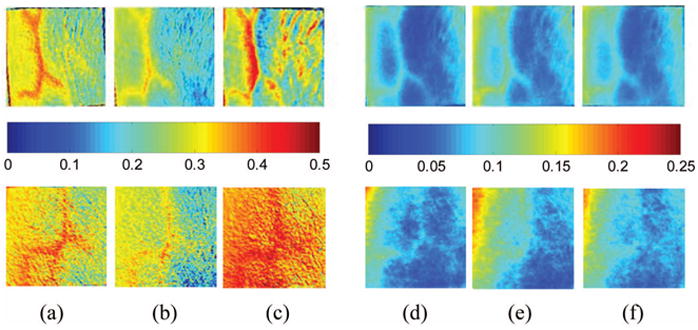
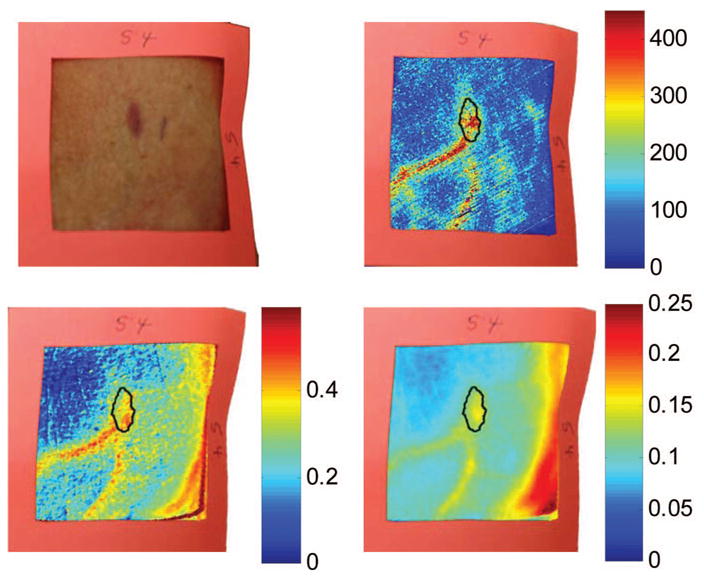
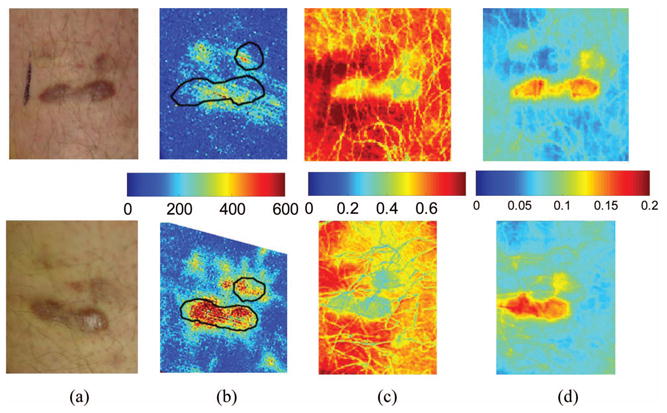
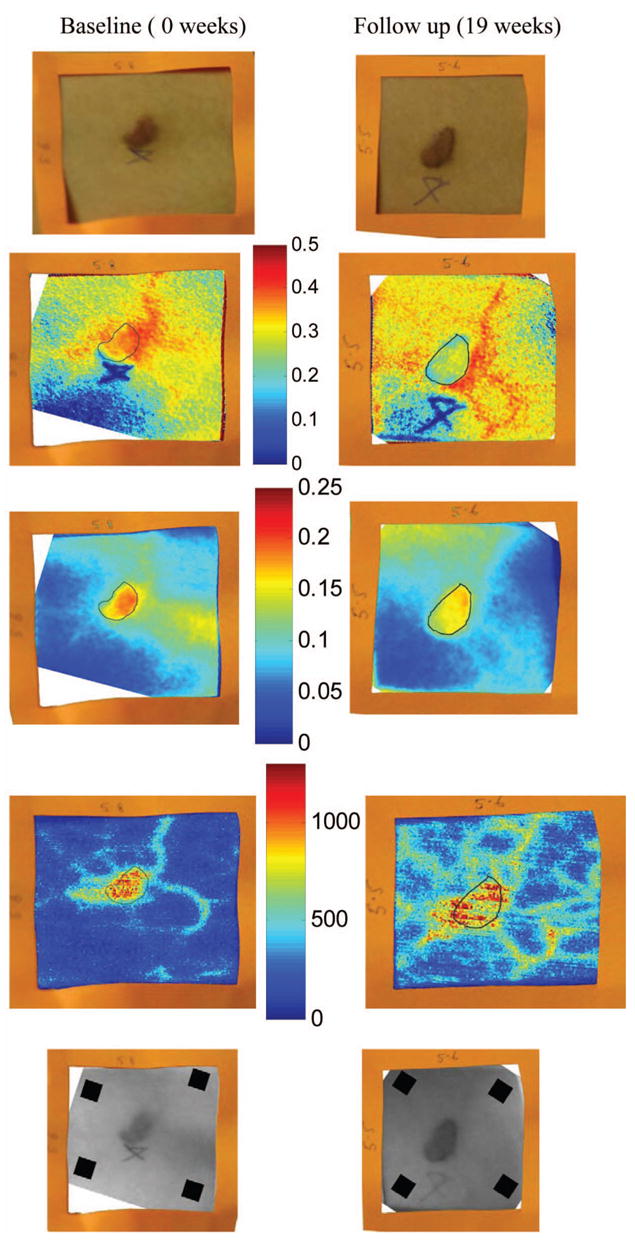
This research describes a noninvasive, noncontact method used to quantitatively analyze the functional characteristics of tissue. Multispectral images collected at several near-infrared wavelengths are input into a mathematical optical skin model that considers the contributions from different analytes in the epidermis and dermis skin layers. Through a reconstruction algorithm, we can quantify the percent of blood in a given area of tissue and the fraction of that blood that is oxygenated. Imaging normal tissue confirms previously reported values for the percent of blood in tissue and the percent of blood that is oxygenated in tissue and surrounding vasculature, for the normal state and when ischemia is induced. This methodology has been applied to assess vascular Kaposi's sarcoma lesions and the surrounding tissue before and during experimental therapies. The multispectral imaging technique has been combined with laser Doppler imaging to gain additional information. Results indicate that these techniques are able to provide quantitative and functional information about tissue changes during experimental drug therapy and investigate progression of disease before changes are visibly apparent, suggesting a potential for them to be used as complementary imaging techniques to clinical assessment.


Figures

Fig. 1
Fig. 1
(a) Schematic of the original NIR multispectral imaging system. The filter wheel in front of the CCD camera contains six filters of 700, 750, 800, 850, 900, and 1000 nm. (b) Schematic of upgraded NIR spectroscopy system. The light source is projected directly in front of the CCD camera so that the light shines perpendicular to the object surface.
Fig. 2
Fig. 2
Spectral images of a normal subject’s arm at six NIR wavelengths (top row) before any calibrations and (bottom row) after intensity, source, and camera calibrations. The gray-scale bar shows the intensity of the reflected light. Note that tissue image intensity is normalized after the calibrations.
Fig. 3
Fig. 3
Fit of the standardized scaling factor that is used in Eq. (1) (R2=0.8839). This factor is different for each person and each visit. Each point on the graph indicates a normal subject with reasonable values of tissue oxygenation and blood volume based on published data.
Fig. 4
Fig. 4
Images comparing a normal subject’s left and right forearm. Column 1 shows the calibrated 700-nm multispectral images collected from the system of each forearm. Column 2 shows the spatial maps of blood volume (Vblood) and oxygenated hemoglobin (Voxy) that were reconstructed from the set of NIR spectral images. Note that both arms show similar quantitative values for oxygenated hemoglobin and blood volume.
Fig. 5
Fig. 5
Images comparing a normal subject’s left and right forearm. Column 1 shows the calibrated 700-nm multispectral images collected from the system of each forearm. Column 2 shows the spatial maps of blood volume (Vblood) and oxygenated hemoglobin (Voxy) that were reconstructed from the set of NIR spectral images. Note that both arms show similar quantitative values for oxygenated hemoglobin and blood volume.
Fig. 6
Fig. 6
Experiment showing (top row) oxygenated hemoglobin and (bottom row) blood volume during occlusion showing reactive hyperemia: (a) 0 min, (b) after 5 min of occlusion, and (c) 1 min after releasing occlusion. During the occlusion, Voxy decreased and then when the occlusion was released, Voxy increased above the initial state. A slight increase in Vblood was seen after a 5-min occlusion period.
Fig. 7
Fig. 7
Experiment showing oxygenated hemoglobin and blood volume during occlusion showing reactive hyperemia for the same subject on two visits (top row is visit 1 and bottom row is visit 2). (Bottom row) visit 2: (a) Voxy at 0 min, (b) Voxy after 5 min of occlusion, (c) Voxy 1 min after releasing occlusion, (d) Vblood at 0 min, (e) Vblood after 5 min of occlusion, and (f) Vblood 1 min after releasing occlusion. During the occlusion, Voxy decreased and then when the occlusion was released, Voxy increased above the initial state. A slight increase in Vblood was seen after a 5-min occlusion period and decreased toward the initial state 1 min after releasing the occlusion.
Fig. 8
Fig. 8
Images of Kaposi’s sarcoma subject on entry onto drug treatment protocol: (top left) digital image; (top right) laser Doppler image showing blood flux; (bottom left) reconstructed map of fraction of oxygenated hemoglobin; and (bottom right) reconstructed map of fraction of blood in tissue. There is increased blood flux, blood volume, and fraction of HbO2 in the lesion compared to the surrounding tissue.
Fig. 9
Fig. 9
Images of Kaposi’s sarcoma subject (top row) on entry onto drug treatment protocol and (bottom row) after 3 weeks of experimental therapy: (a) digital image; (b) laser Doppler image showing blood flux; (c) reconstructed map of fraction of oxygenated hemoglobin; and (d) reconstructed map of fraction of blood in tissue. The lesions appear hypoxic compared to the surrounding, but the laser Doppler and blood volume images show higher blood flux and volume in the lesions.
Fig. 10
Fig. 10
Images of Kaposi’s sarcoma subject receiving antiretroviral therapy (left column) upon entry onto protocol at 0 weeks and (right column) follow-up 19 weeks later: (top) digital image; (row one) reconstructed map of oxygenated hemoglobin; (row two) reconstructed map of blood volume; (row three) laser Doppler images; and (row 4) 700-nm spectroscopic image showing the four ROIs used to average the oxygenated hemoglobin and blood volume outside the lesion. This patient had a clinical diagnosis of progressive disease before the follow-up visit. Decreased oxygenated hemoglobin fraction, blood volume, and blood flux in the lesion are apparent at the follow-up visit. Increased overall vasculature and oxygenated hemoglobin can be seen in the laser Doppler and oxygenated hemoglobin images at follow-up.

Similar articles

Cited by

References

    1. Taylor D, Simonson S. Use of near-infrared spectroscopy to monitor tissue oxygenation. New Horiz. 1996;4(4):420–425. - PubMed
    1. Kollias N, Gillies R, Muccini JA, Uyeyama R, Phillips S, Drake L. A single parameter, oxygenated hemoglobin, can be used to quantify experimental irritant-induced inflammation. J Invest Dermatol. 1995;104(3):421–424. - PubMed
    1. Wagnieres G, Cheng S, Zellweger M, Utke N, Braichotte D, Ballini JP, van den Bergh H. An optical phantom with tissue-like properties in the visible for use in PDT and fluorescence spectroscopy. Phys Med Biol. 1997;42:1415–1426. - PubMed
    1. Shah N, Cerussi A, Eker C, Espinoza J, Butler J, Fishkin J, Hornung R, Tromberg B. Noninvasive functional optical spectroscopy of human breast tissue. Proc Natl Acad Sci USA. 2001;98(8):4420–4425. - PMC - PubMed
    1. Stranc MF, Sowa MG, Abdulrauf B, Mantsch HH. Assessment of tissue viability using near-infrared spectroscopy. Br J Plast Surg. 1998;51:210–217. - PubMed

Publication types

MeSH terms