

Label-free molecular imaging of atherosclerotic lesions using multimodal nonlinear optical microscopy
- PMID: 17994895
- PMCID: PMC2646612
- DOI: 10.1117/1.2795437
Label-free molecular imaging of atherosclerotic lesions using multimodal nonlinear optical microscopy
Abstract
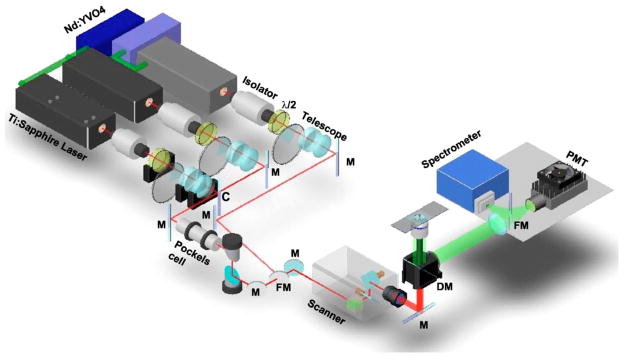
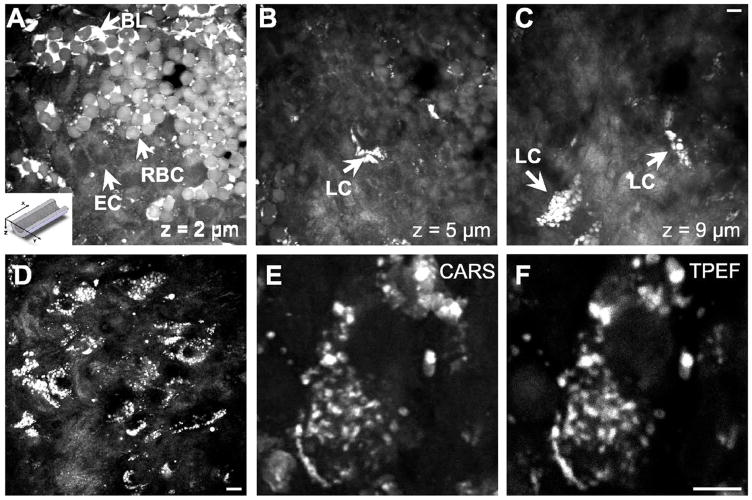
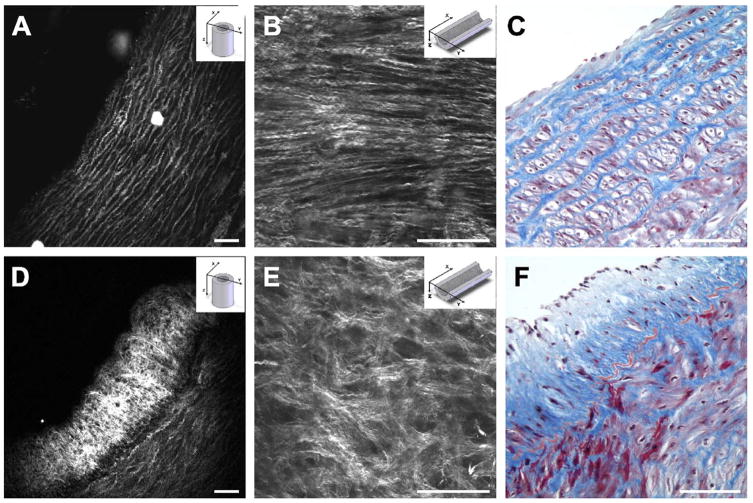
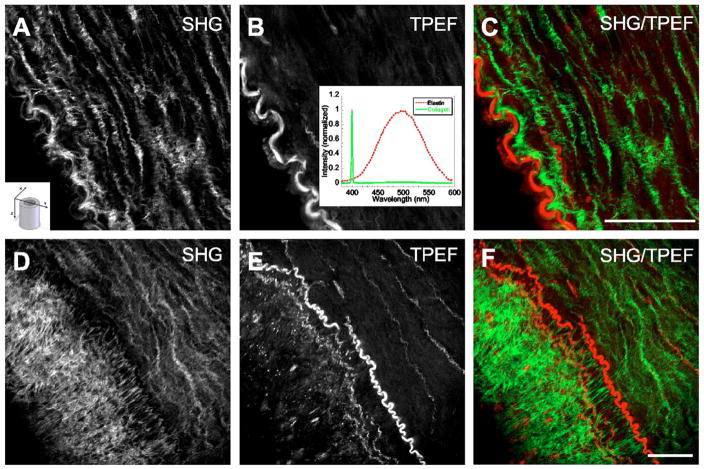
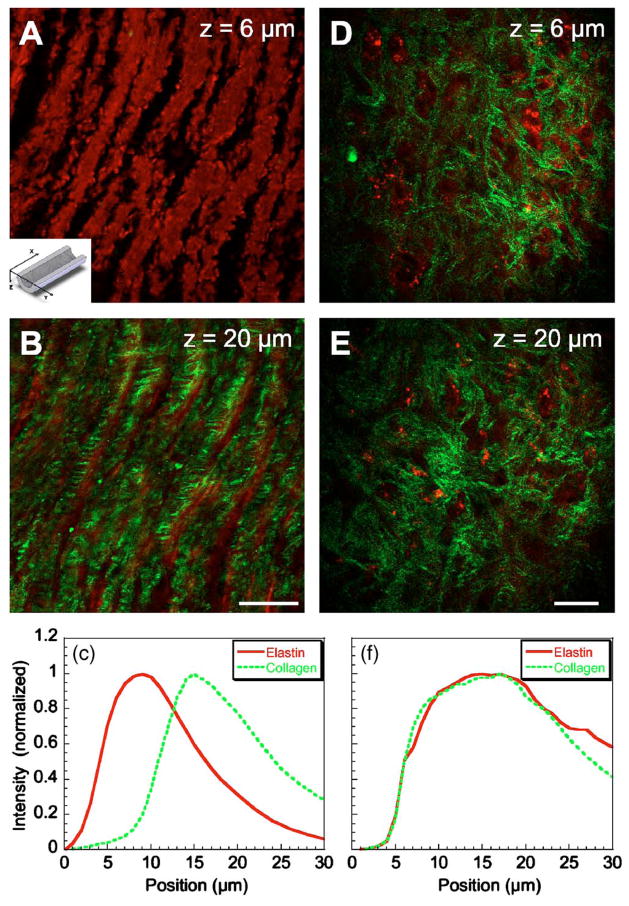
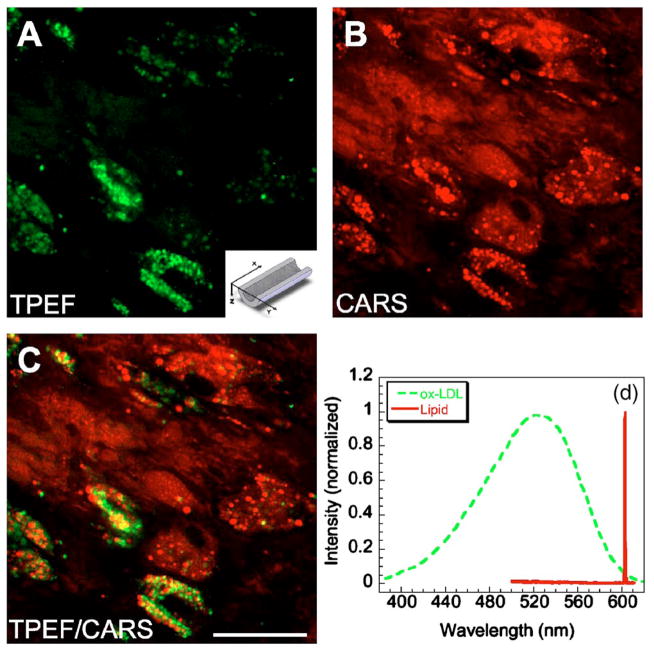
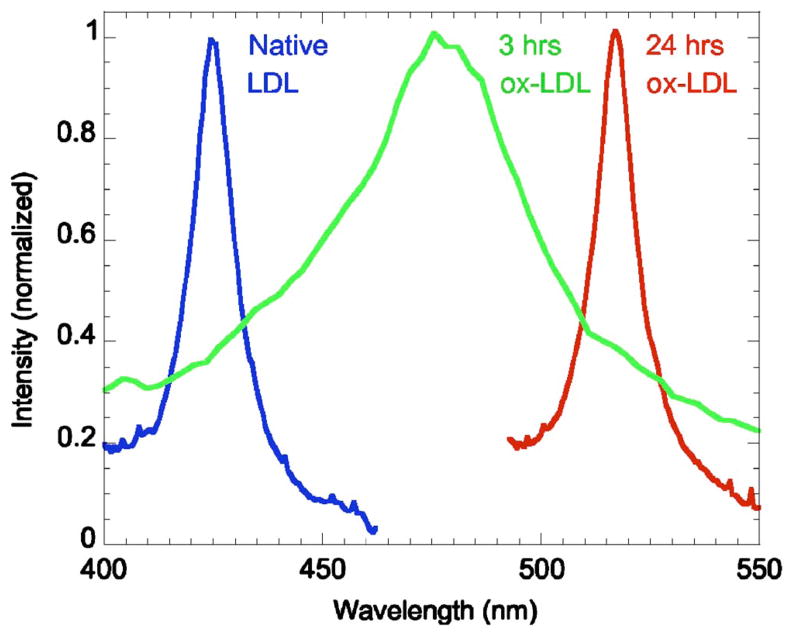
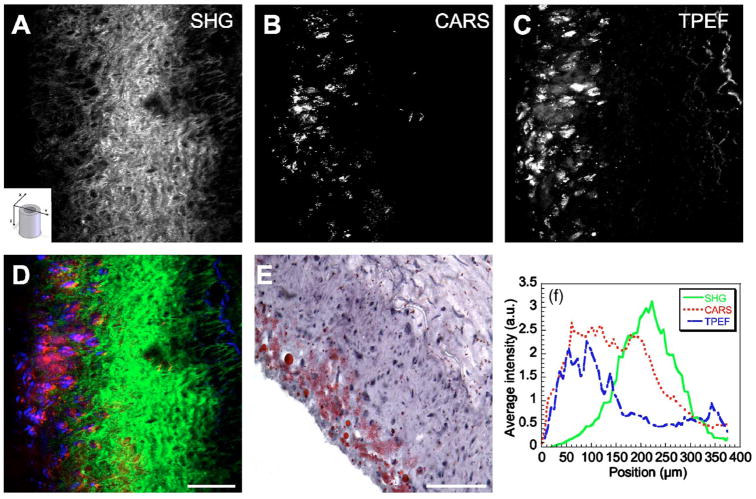
Arterial tissues collected from Ossabaw swine bearing metabolic syndrome-induced cardiovascular plaques are characterized by multimodal nonlinear optical microscopy that allows coherent anti-Stokes Raman scattering, second-harmonic generation, and two-photon excitation fluorescence imaging on the same platform. Significant components of arterial walls and atherosclerotic lesions, including endothelial cells, extracellular lipid droplets, lipid-rich cells, low-density lipoprotein aggregates, collagen, and elastin are imaged without any labeling. Emission spectra of these components are obtained by nonlinear optical microspectrometry. The nonlinear optical contrast is compared with histology of the same sample. Multimodal nonlinear optical imaging of plaque composition also allows identification of atherosclerotic regions that are vulnerable to rupture risk. The demonstrated capability of nonlinear optical microscopy for label-free molecular imaging of atherosclerotic lesions with 3-D submicrometric resolution suggests its potential application to the diagnosis of atherosclerotic plaques, determination of their rupture risk, and design of individualized drug therapy based on plaque composition.
Figures
Similar articles
-
Imaging and quantitative analysis of atherosclerotic lesions by CARS-based multimodal nonlinear optical microscopy.Arterioscler Thromb Vasc Biol. 2009 Sep;29(9):1342-8. doi: 10.1161/ATVBAHA.109.189316. Epub 2009 Jun 11. Arterioscler Thromb Vasc Biol. 2009. PMID: 19520975 Free PMC article.
-
Multimodal nonlinear optical imaging of atherosclerotic plaque development in myocardial infarction-prone rabbits.J Biomed Opt. 2010 Mar-Apr;15(2):020501. doi: 10.1117/1.3353960. J Biomed Opt. 2010. PMID: 20459215
-
Nonlinear magic: multiphoton microscopy in the biosciences.Nat Biotechnol. 2003 Nov;21(11):1369-77. doi: 10.1038/nbt899. Nat Biotechnol. 2003. PMID: 14595365 Review.
-
Effect of excitation wavelength on penetration depth in nonlinear optical microscopy of turbid media.J Biomed Opt. 2009 Jan-Feb;14(1):010508. doi: 10.1117/1.3081544. J Biomed Opt. 2009. PMID: 19256688 Free PMC article.
-
[Nonlinear Microscopy in Ophthalmology: Principles and Pathbreaking Applications].Klin Monbl Augenheilkd. 2015 Dec;232(12):1365-73. doi: 10.1055/s-0041-109020. Epub 2015 Dec 17. Klin Monbl Augenheilkd. 2015. PMID: 26678898 Review. German.
Cited by
-
Piceatannol, natural polyphenolic stilbene, inhibits adipogenesis via modulation of mitotic clonal expansion and insulin receptor-dependent insulin signaling in early phase of differentiation.J Biol Chem. 2012 Mar 30;287(14):11566-78. doi: 10.1074/jbc.M111.259721. Epub 2012 Jan 31. J Biol Chem. 2012. PMID: 22298784 Free PMC article.
-
Multimodal microscopy for the simultaneous visualization of five different imaging modalities using a single light source.Biomed Opt Express. 2021 Aug 9;12(9):5452-5469. doi: 10.1364/BOE.430677. eCollection 2021 Sep 1. Biomed Opt Express. 2021. PMID: 34692194 Free PMC article.
-
Non-destructive two-photon excited fluorescence imaging identifies early nodules in calcific aortic-valve disease.Nat Biomed Eng. 2017 Nov;1(11):914-924. doi: 10.1038/s41551-017-0152-3. Epub 2017 Nov 6. Nat Biomed Eng. 2017. PMID: 29456878 Free PMC article.
-
Differentiating atherosclerotic plaque burden in arterial tissues using femtosecond CARS-based multimodal nonlinear optical imaging.Biomed Opt Express. 2010 Jul 14;1(1):59-73. doi: 10.1364/BOE.1.000059. Biomed Opt Express. 2010. PMID: 21258446 Free PMC article.
-
Ca2+ regulatory mechanisms of exercise protection against coronary artery disease in metabolic syndrome and diabetes.J Appl Physiol (1985). 2011 Aug;111(2):573-86. doi: 10.1152/japplphysiol.00373.2011. Epub 2011 May 19. J Appl Physiol (1985). 2011. PMID: 21596923 Free PMC article. Review.
References
-
- Rosamond W, et al. Heart disease and stroke statistics—2007 update: A report from the American Heart Association Statistics Committee and Stroke Statistics Subcommittee. Circulation. 2007;115:69–e171. - PubMed
-
- Libby P. Inflammation in atherosclerosis. Nature (London) 2002;420:868–874. - PubMed
-
- Fayad ZA, Fuster V. Clinical imaging of the high-risk or vulnerable atherosclerotic plaque. Circ Res. 2001;89:305–316. - PubMed
-
- Fischer A, Gutstein DE, Fayad ZA, Fuster V. Predicting plaque rupture: enhancing diagnosis and clinical decision-making in coronary artery disease. Vasc Med. 2000;5:163–172. - PubMed
Publication types
MeSH terms
Grants and funding
LinkOut - more resources
Full Text Sources
Other Literature Sources
Medical
