. 2008 Mar;104(6):1622-36.
doi: 10.1111/j.1471-4159.2007.05104.x. Epub 2007 Nov 7.

Altered expression and subcellular distribution of GRK subtypes in the dopamine-depleted rat basal ganglia is not normalized by l-DOPA treatment

Affiliations

Altered expression and subcellular distribution of GRK subtypes in the dopamine-depleted rat basal ganglia is not normalized by l-DOPA treatment

M Rafiuddin Ahmed et al. J Neurochem. 2008 Mar.

Abstract

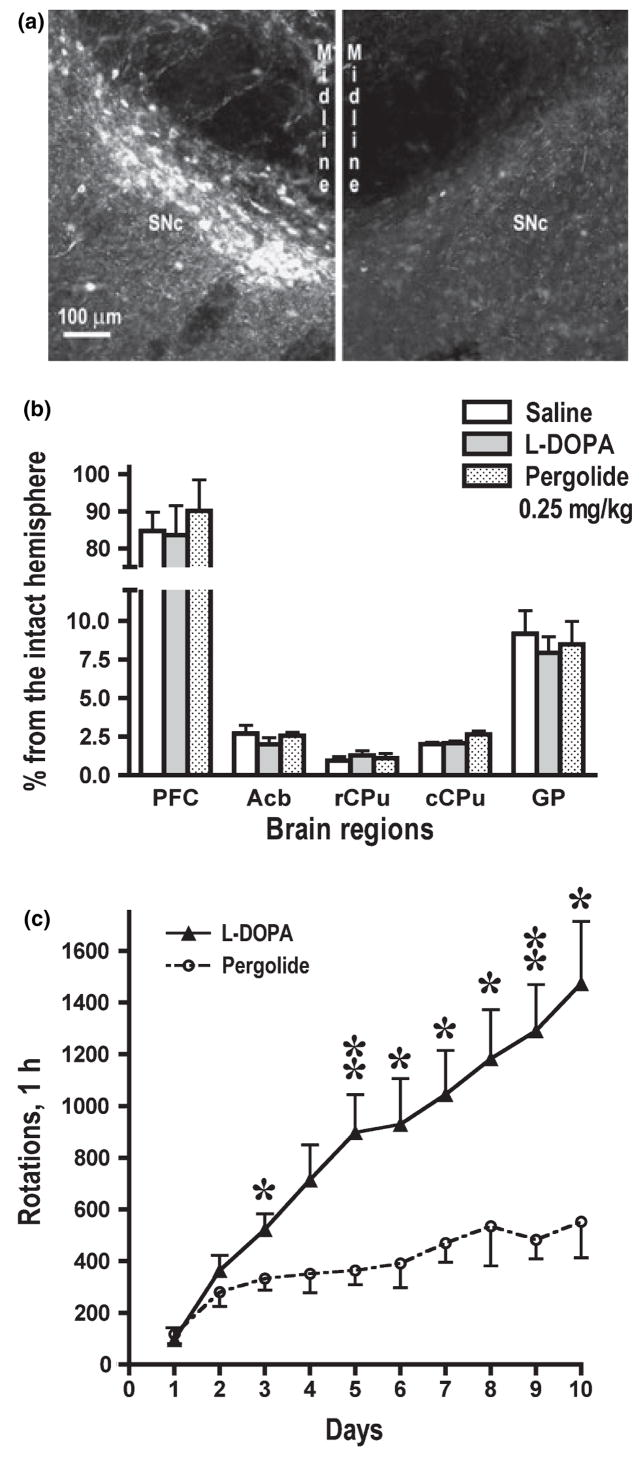
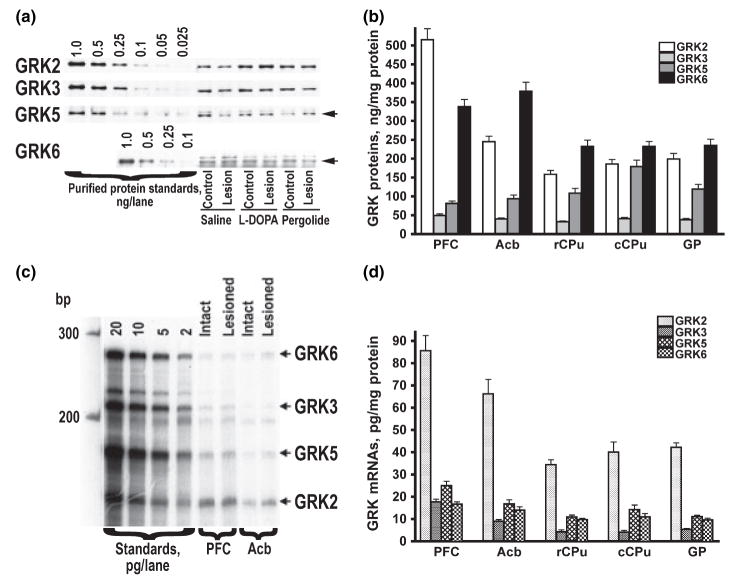
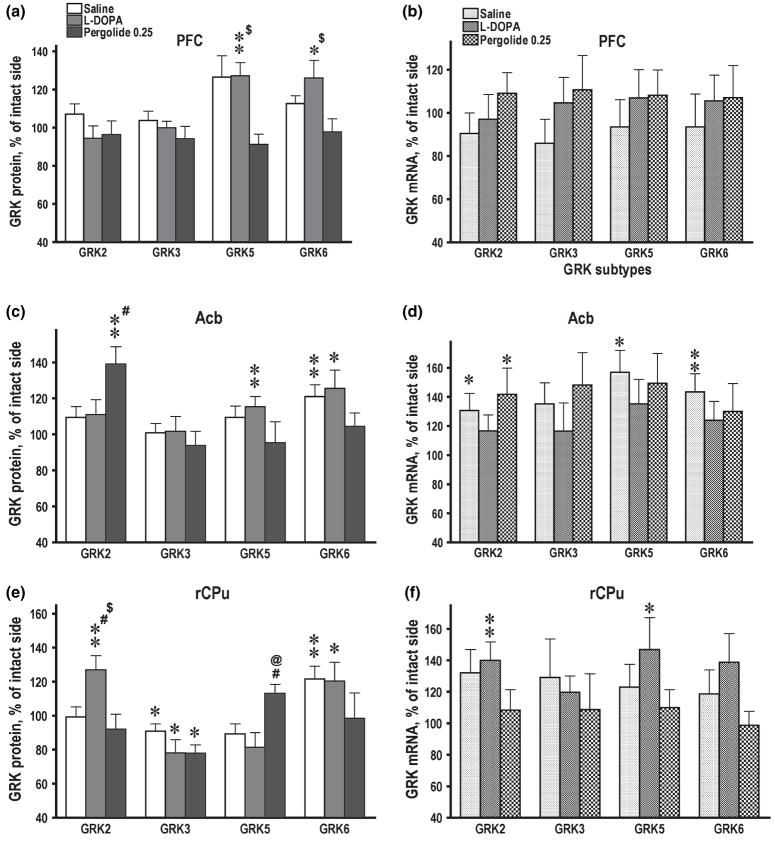
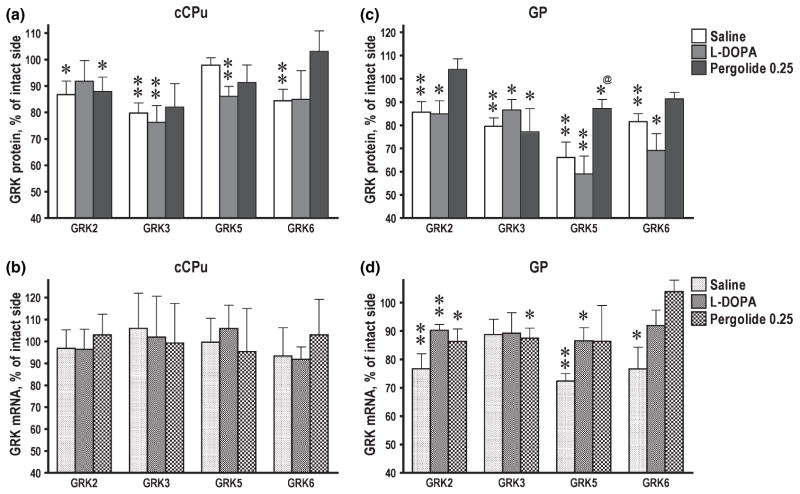
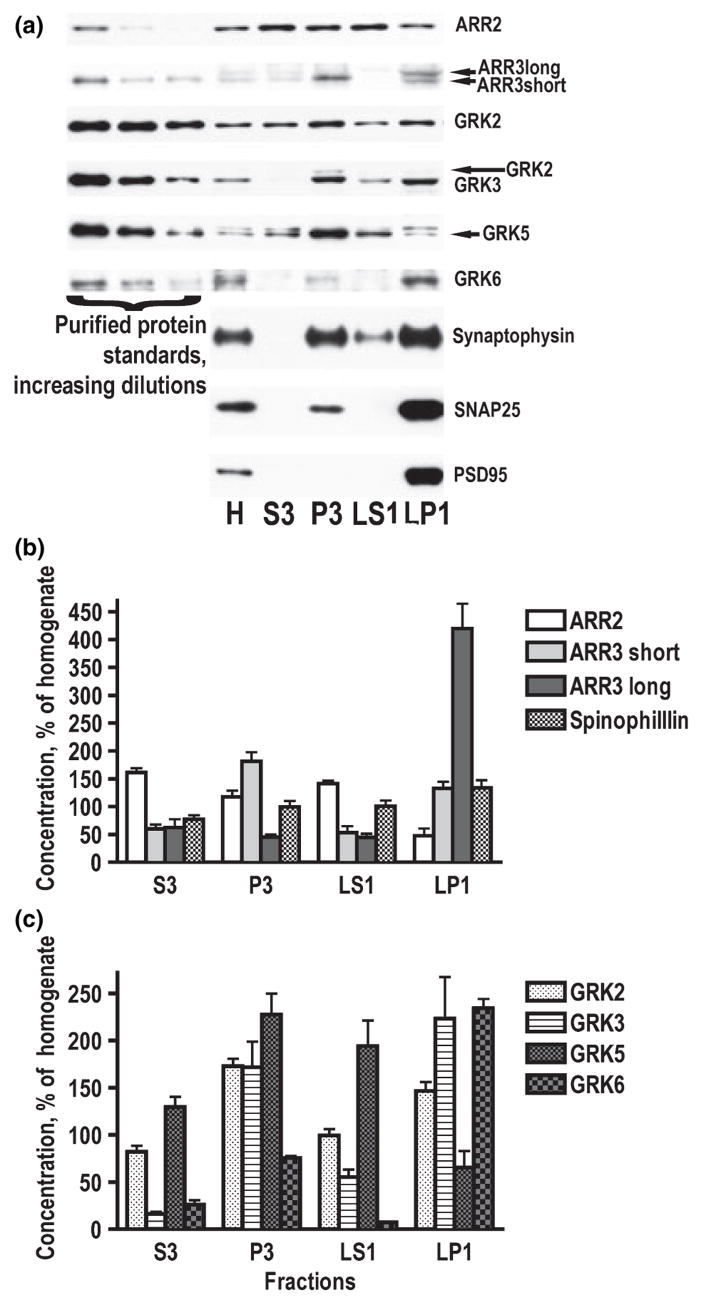
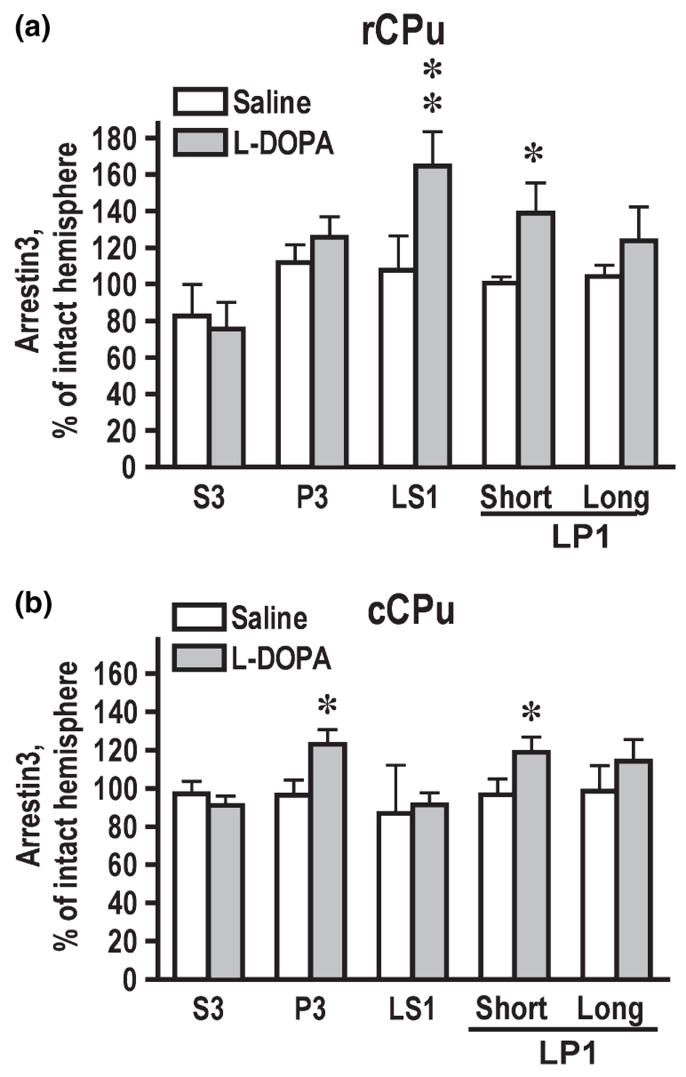
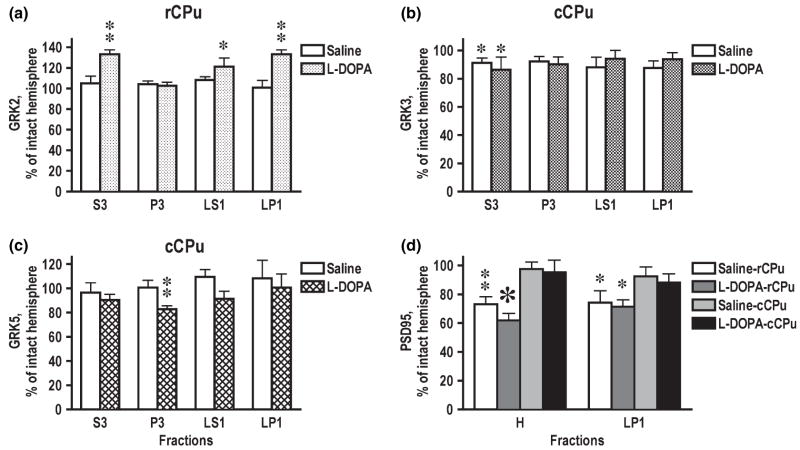
Dysregulation of dopamine (DA) receptors is believed to underlie Parkinson's disease pathology and l-DOPA-induced motor complications. DA receptors are subject to regulation by G protein-coupled receptor kinases (GRKs) and arrestins. DA lesion with 6-hydroxydopamine caused multiple protein- and brain region-specific changes in the expression of GRKs. In the globus pallidus, all four GRK isoforms (GRK2, 3, 5, 6) were reduced in the lesioned hemisphere. In the caudal caudate-putamen (cCPu) three GRK isoforms (GRK2, 3, 6) were decreased by DA depletion. The decrease in GRK proteins in globus pallidus, but not cCPu, was mirrored by reduction in mRNA. GRK3 protein was reduced in the rostral caudate-putamen (rCPu), whereas other isoforms were either unchanged or up-regulated. GRK6 protein and mRNA were up-regulated in rCPu and nucleus accumbens. l-DOPA (25 mg/kg, twice daily for 10 days) failed to reverse changes caused by DA depletion, whereas D(2)/D(3) agonist pergolide (0.25 mg/kg daily for 10 days) restored normal levels of expression of GRK5 and 6. In rCPu, GRK2 protein was increased in most subcellular fractions by l-DOPA but not by DA depletion alone. Similarly, l-DOPA up-regulated arrestin3 in membrane fractions in both regions. GRK5 was down-regulated by l-DOPA in cCPu in the light membrane fraction, where this isoform is the most abundant. The data suggest that alterations in the expression and subcellular distribution of arrestins and GRKs contribute to pathophysiology of Parkinson's disease. Thus, these proteins may be targets for antiparkinsonian therapy.


Figures

Fig. 1
Fig. 1
Characterization of the 6-hydroxydopamine-induced dopaminergic denervation and rotational behavior. (a) High power photomicrograph of a representative nigral section immunostained for TH. Left image shows the substantia nigra in the intact hemisphere, right image – in the hemisphere lesioned with 6-hydroxydopamine. The photograph illustrates almost complete loss of TH-positive dopaminergic neurons on the lesioned side. (b) Quantification of TH immunoreactivity in the striatal regions and prefrontal cortex by western blot. The striatum and nucleus accumbens show severe depletion of dopaminergic fibers, whereas the loss of TH immunoreactivity in the globus pallidus is less pronounced. Minimal loss of TH immunoreactivity is observed in the prefrontal cortex. There were no significant differences among the three experimental groups (saline, L-DOPA, and pergolide) in the degree of dopaminergic lesion. (c) The number (mean ± SEM) of contralateral rotations during the first hour after daily L-DOPA administration. The rotation frequency in the L-DOPA- and pergolide-treated group was compared for each day by ANOVA with Group as main factor. *p < 0.05, **p < 0.01 to the corresponding values in the pergolide-treated group. The increase in the rotation frequency in the course of the treatment (behavioral sensitization) was significant in both groups: F(9108) = 11.28 p < 0.0001, and F(9,90) = 8.21, p < 0.0001, for the L-DOPA and pergolide group, respectively, according to repeated measure ANOVA with day repeated measure factor.
Fig. 2
Fig. 2
(a) Representative western blots demonstrating antibody specificity and the expression of GRK isoforms in the rat striatum. To detect GRK2, 2.5 μg protein per lane was used; for the GRK3 and 5 –5 μg protein per lane, and 10 μg protein per lane for GRK6. (b) Comparison of concentrations of GRK protein levels in the normal rat brain. Bar graph represents the mean ± SE of the amount (ng/mg protein) of GRK isoforms in the striatal subterritories and prefrontal cortex of the control rat brain. The GRK concentrations were measured by quantitative western blot as described in Materials and methods. (c) Representative autoradiogram of RNAse protection assay measuring the concentrations of GRK mRNAs in the rat brain. mRNAs of four GRK isoforms were measured in the single reaction using specific probes of different size. Left four lanes show protected fragments generated from different amounts of GRK mRNAs synthesized in a in vitro transcription reactions using full-length GRK cDNA as templates. These standard samples were included in all experiments and were used to generate calibration curves to convert relative values into absolute concentrations of GRK mRNAs. (d) Comparison of concentrations of mRNA of GRK subtypes in the control rat brain. Bar graph represents the mean ± SE of the amount (pg/mg protein) of GRK mRNAs in the striatal subterritories and prefrontal cortex of the control rat brain. The GRK concentrations were measured by RNAse protection assay as described in Materials and methods.
Fig. 3
Fig. 3
Expression of GRK isoforms in the control and lesioned hemisphere in 6-hydroxydopamine-lesioned rats treated with saline, L-DOPA, or pergolide. Bar graphs show the concentrations of GRK proteins (a, c, e) and mRNA (b, d, f) in the prefrontal cortex (PFC) (a, b), nucleus accumbens (Acb) (c, d) and rostral caudate-putamen (rCPu) (e, f) in the lesioned hemisphere as percent of the corresponding values in the intact hemisphere (means ± SE). The GRK proteins were measured by western blot and mRNAs by RNAse protection assay as described in Materials and methods. The data were statistically analyzed separately for individual brain groups by repeated-measure one-way ANOVA with Hemisphere as a factor. *p < 0.05, **p < 0.01 to the values in the intact hemisphere. #p < 0.05 to the control group; @p < 0.05 to the L-DOPA group; $p < 0.05 to the pergolide group according to one-way ANOVA with Group as main factor followed by Bonferroni/Dunn post hoc comparison.
Fig. 4
Fig. 4
Expression of GRK isoforms in the control and lesioned hemisphere in 6-hydroxydopamine-lesioned rats treated with saline, L-DOPA, or pergolide. Bar graphs show the concentrations of GRK proteins (a, c) and mRNA (b, d) in the caudal caudate-putamen (cCPu) (a, b) and globus pallidus (c, d) in the lesioned hemisphere as percent of the corresponding values in the intact hemisphere (means ± SE). The GRK proteins were measured by western blot and mRNAs by RNAse protection assay as described in Materials and methods. The data were statistically analyzed separately for individual brain groups by repeated-measure one-way ANOVA with Hemisphere as a factor. *p < 0.05, **p < 0.01 to the values in the intact hemisphere. @p < 0.05 to the L-DOPA group according to one-way ANOVA with Group as main factor followed by Bonferroni/Dunn post hoc comparison.
Fig. 5
Fig. 5
Subcellular distribution of arrestin and GRK isoforms in the rat striatum. The striatal tissue was fractioned as described in Materials and methods. (a) Representative western blots showing the distribution of arrestins and GRKs in subcellular fractions. Corresponding purified proteins were used to identify bands. Only long splice variant of arrestin2 was detected. The most abundant splice variant of arrestin3 is short, but long variant predominated in the synaptic membrane fraction. (b) Quantification of western blot results showing relative concentrations (mean ± SEM) of arrestins and spinophillin in subcellular fractions (homogenate – 100%). (c) Subcellular distribution of GRK isoforms expressed as mean ± SEM (homogenate – 100%).
Fig. 6
Fig. 6
Changes in the concentration of arrestin3 in the subcellular fractions in the rostral (rCPu) (a) and caudal caudate-putamen (cCPu) (b) caused by dopamine depletion and L-DOPA treatment (shown as percent of values for the intact hemisphere; mean ± SEM). The data were statistically analyzed for individual brain regions, groups, and subcellular fractions by repeated-measures one-way ANOVA with Hemisphere as a factor. *p < 0.05, **p < 0.01 to the values in the intact hemisphere.
Fig. 7
Fig. 7
Changes in the concentration of GRKs in the subcellular fractions in the rostral (rCPu) or caudal caudate-putamen (cCPu) caused by dopamine depletion and L-DOPA treatment (shown as percents of values for the intact hemisphere; mean ± SEM). (a) GRK2; (b) GRK3; (c) GRK5; (d) PSD-95. The data were statistically analyzed for individual brain regions, groups, and subcellular fractions by repeated-measure one-way ANOVA with Hemisphere as a factor. *p < 0.05, **p < 0.01 to the values in the intact hemisphere.

References

    1. Ahn S, Nelson CD, Garrison TR, Miller WE, Lefkowitz RJ. Desensitization, internalization, and signaling functions of beta-arrestins demonstrated by RNA interference. Proc Natl Acad Sci USA. 2003;100:1740–1744. - PMC - PubMed
    1. Ahn S, Wei H, Garrison TR, Lefkowitz RJ. Reciprocal regulation of angiotensin receptor-activated extracellular signal-regulated kinases by beta-arrestins 1 and 2. J Biol Chem. 2004a;279:7807–7811. - PubMed
    1. Ahn S, Shenoy SK, Wei H, Lefkowitz RJ. Differential kinetic and spatial patterns of beta-arrestin and G protein-mediated ERK activation by the angiotensin II receptor. J Biol Chem. 2004b;279:35518–35525. - PubMed
    1. Alexander GE, Crutcher MD. Functional architecture of basal ganglia circuits: neural substrates of parallel processing. Trends Neurosci. 1990;13:266–271. - PubMed
    1. Arriza JL, Dawson TM, Simerly RB, Martin LJ, Caron MG, Snyder SH, Lefkowitz RJ. The G-protein-coupled receptor kinases bARK1 and bARK2 are widely distributed at synapses in rat brain. J Neurosci. 1992;12:4045–4055. - PMC - PubMed

Publication types

MeSH terms