. 2007 Nov 9:8:434.
doi: 10.1186/1471-2105-8-434.

A Hidden Markov Model to estimate population mixture and allelic copy-numbers in cancers using Affymetrix SNP arrays

Affiliations

A Hidden Markov Model to estimate population mixture and allelic copy-numbers in cancers using Affymetrix SNP arrays

Philippe Lamy et al. BMC Bioinformatics. .

Abstract

Background: Affymetrix SNP arrays can interrogate thousands of SNPs at the same time. This allows us to look at the genomic content of cancer cells and to investigate the underlying events leading to cancer. Genomic copy-numbers are today routinely derived from SNP array data, but the proposed algorithms for this task most often disregard the genotype information available from germline cells in paired germline-tumour samples. Including this information may deepen our understanding of the "true" biological situation e.g. by enabling analysis of allele specific copy-numbers. Here we rely on matched germline-tumour samples and have developed a Hidden Markov Model (HMM) to estimate allelic copy-number changes in tumour cells. Further with this approach we are able to estimate the proportion of normal cells in the tumour (mixture proportion).

Results: We show that our method is able to recover the underlying copy-number changes in simulated data sets with high accuracy (above 97.71%). Moreover, although the known copy-numbers could be well recovered in simulated cancer samples with more than 70% cancer cells (and less than 30% normal cells), we demonstrate that including the mixture proportion in the HMM increases the accuracy of the method. Finally, the method is tested on HapMap samples and on bladder and prostate cancer samples.

Conclusion: The HMM method developed here uses the genotype calls of germline DNA and the allelic SNP intensities from the tumour DNA to estimate allelic copy-numbers (including changes) in the tumour. It differentiates between different events like uniparental disomy and allelic imbalances. Moreover, the HMM can estimate the mixture proportion, and thus inform about the purity of the tumour sample.


Figures

Figure 1
Figure 1
States and transition matrix of the HMM. A. This figure shows the definition of the states in the HMM. The genotype call for the germline DNA is given by the letter N = AB, AA or BB. For each state, the total DNA copy-number and the allelic copy-numbers are given. State 0 is the germline state also called the normal state; state 1 corresponds to a heterozygous deletion (loss of one allele); state 2 corresponds to a homozygous deletion (loss of two alleles); state 3 corresponds to uniparental di/polysomy (loss of one allele and duplication or multiplication of the other allele); state 4 corresponds to unbalanced amplification (duplication or multiplication of only one allele); state 5 corresponds to balanced amplification (duplication or multiplication of both alleles). Notice that when the SNP marker in the germline DNA is homozygous, states 3, 4 and 5 are very similar and states 0 and 3 cannot be differentiated in case of uniparental disomy. B. Visual interpretation of the states. C. Transition matrix. The transition probabilities are the probabilities to move from one state for a SNP to another state for the next SNP. The rest of the matrix is given by the detailed balance equation and symmetry. D. Visual interpretation of the transition parameters. The figure represents two consecutive SNPs in the sample.
Figure 2
Figure 2
Estimation of the transition parameters and percentage of SNPs in state 0 in the real data. A. Boxplots for the p-parameter. B. Boxplots for the r-parameter. C. Boxplots for the percentage of estimated SNPs in state 0 (normal state). BN: Bladder Normal samples; HN: Hapmap Normal samples; PN: Prostate Normal samples; BT: Bladder Tumour samples; PT: Prostate Tumour samples.
Figure 3
Figure 3
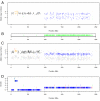
Chromosome 2 in a bladder tumour sample. In this chromosome, we can distinguish two events: an unbalanced amplification coloured in orange (only one allele is duplicated) and a heterozygous deletion of the q-arm coloured in blue. A. For each SNP heterozygous in the germline DNA, the normalized intensities (as defined in Methods equation 4) of each allele are plotted. The colours represent the estimated state of the SNP: black for state 0 (germline state), blue for state 1 (heterozygous deletion: loss of one allele), green for state 2 (homozygous deletion: loss of both alleles), purple for state 3 (uniparental di/polysomy: loss of one allele and multiplication of the other one), orange for state 4 (unbalanced amplification: multiplication of one allele) and red for state 5 (balanced amplification: multiplication of the two alleles). B. Shown is the region of LOH. C. For each SNP homozygous in the germline DNA, the normalized intensities (as defined in Methods equation 4) of each allele are plotted. The absent allele is coloured in grey. D. Shown is the estimated sequence of hidden states. The colours indicate the posterior probabilities of the states: blue > 0.99, green > 0.95, orange > 0.9 and red < 0.9.
Figure 4
Figure 4
Accuracy of our method on simulated data. The percentage of agreement between the recovered state and the original state in the simulated data sets is plotted as a function of the population mixture (percentage of tumour cells in the sample). The simulation were done using different combinations of transition parameters.
Figure 5
Figure 5
An example of uniparental disomy in chromosome 13 in a bladder tumour sample. In this chromosome, we can distinguish uniparental disomy coloured in purple in a region of approximatively 20 Mb and an unbalance amplification in the rest of the q-arm coloured in orange and red. A. For each SNP heterozygous in the germline DNA, the normalized intensities (as defined in Methods equation 4) of each allele are plotted. The colours represent the estimated state of the SNP: black for state 0, blue for state 1, green for state 2, purple for state 3, orange for state 4 and red for state 5. B. Shown is the region of LOH. C. For each SNP homozygous in the germline DNA, the normalized intensities (as defined in Methods equation 4) of each allele are plotted. The absent allele is coloured in grey. D. Shown is the estimated sequence of hidden states. The colour indicates the posterior probabilities of the states: blue > 0.99, green > 0.95, orange > 0.9 and red < 0.9.

References

    1. The NCBI dbSNP database http://www.ncbi.nlm.nih.gov/projects/SNP/index.html
    1. Shen R, Fan JB, Campbell D, Chang W, Chen J, Doucet D, Yeakley J, Bibikova M, Wickham Garcia E, McBride C, Steemers F, Garcia F, Kermani BG, Gunderson K, Oliphant A. High-throughput SNP genotyping on universal bead arrays. Mutat Res. 2005;573:70–82. - PubMed
    1. Matsuzaki H, Dong S, Loi H, Di X, Liu H, Hubbell E, Law J, Berntsen T, Chadha M, Hui H, Yang G, C KG, Webster TA, Cawley S, Walsh PS, Jones KW, Fodor SPA, Mei R. Genotyping over 100,000 SNPs on a pair of oligonucleotide arrays. Nat Methods. 2004;1:109–111. doi: 10.1038/nmeth718. - DOI - PubMed
    1. Hinds DA, Stuve LL, Nilsen GB, Halperin E, Eskin E, Ballinger DG, Frazer KA, Cox DR. Whole-genome patterns of common DNA variation in three human populations. Science. 2005;307:1072–1079. doi: 10.1126/science.1105436. - DOI - PubMed
    1. Kennedy GC, Matsuzaki H, Dong S, Liu WM, Huang J, Liu G, Su X, Cao M, Chen W, Zhang J, Liu W, Yang G, Di X, Ryder T, He Z, Surti U, Phillips MS, Boyce-Jacino MT, Fodor SP, Jones KW. Large-scale genotyping of complex DNA. Nat Biotechnol. 2003;21:1233–1237. doi: 10.1038/nbt869. - DOI - PubMed

Publication types

LinkOut - more resources