

Ganoderma lucidum polysaccharides in human monocytic leukemia cells: from gene expression to network construction
- PMID: 17996095
- PMCID: PMC2211495
- DOI: 10.1186/1471-2164-8-411
Ganoderma lucidum polysaccharides in human monocytic leukemia cells: from gene expression to network construction
Abstract
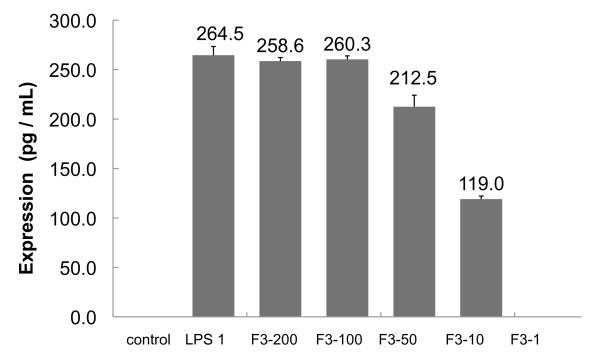
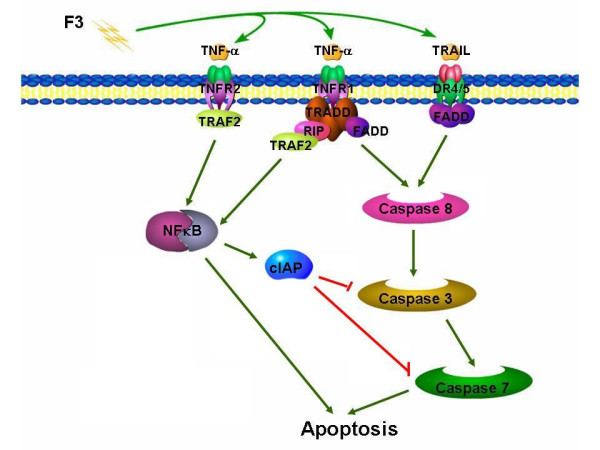
Background: Ganoderma lucidum has been widely used as a herbal medicine for promoting health and longevity in China and other Asian countries. Polysaccharide extracts from Ganoderma lucidum have been reported to exhibit immuno-modulating and anti-tumor activities. In previous studies, F3, the active component of the polysaccharide extract, was found to activate various cytokines such as IL-1, IL-6, IL-12, and TNF-alpha. This gave rise to our investigation on how F3 stimulates immuno-modulating or anti-tumor effects in human leukemia THP-1 cells.
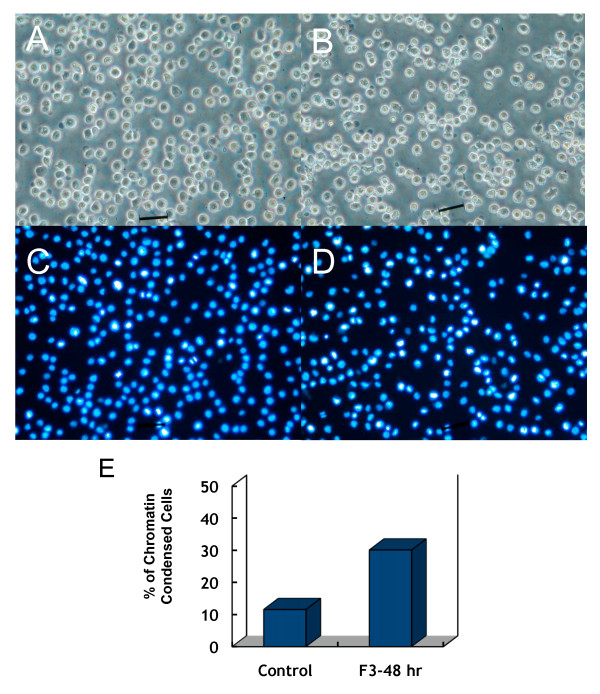
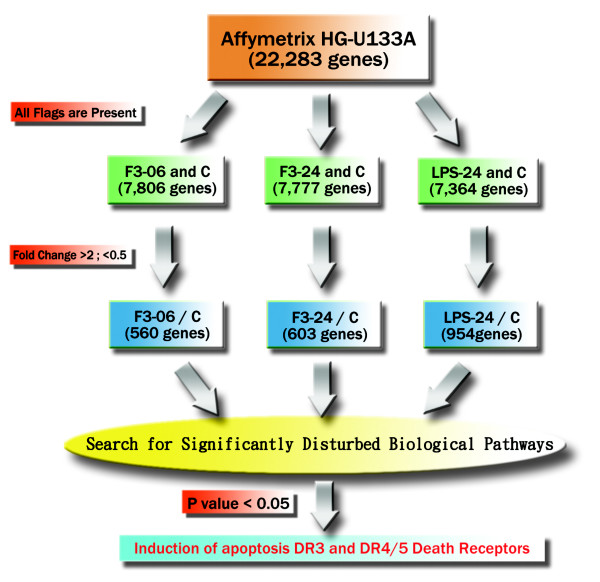
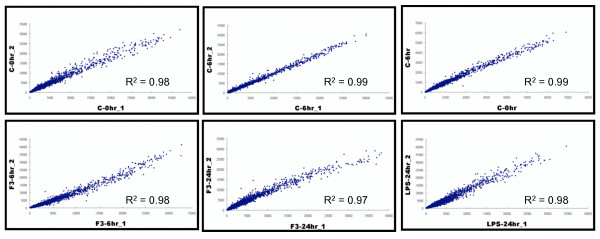
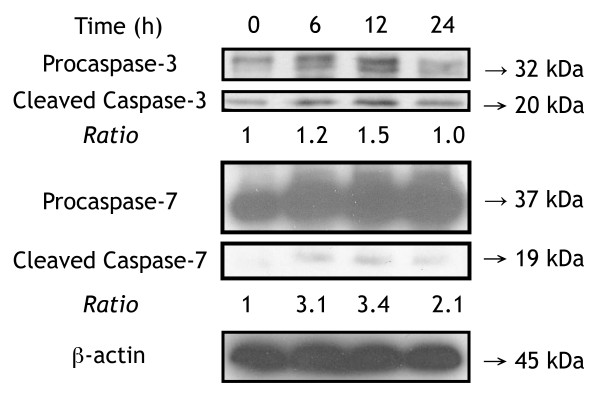
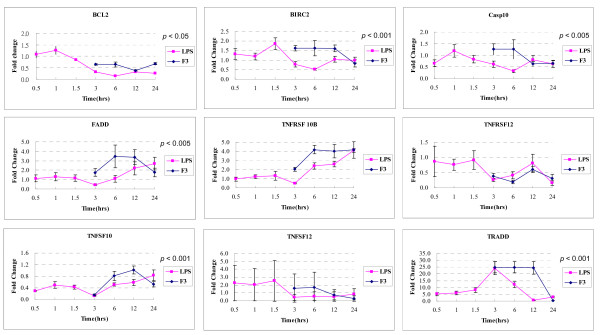
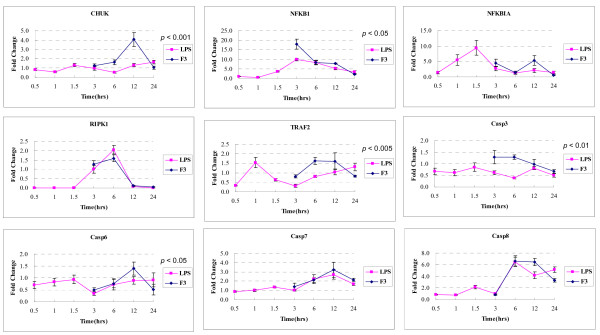
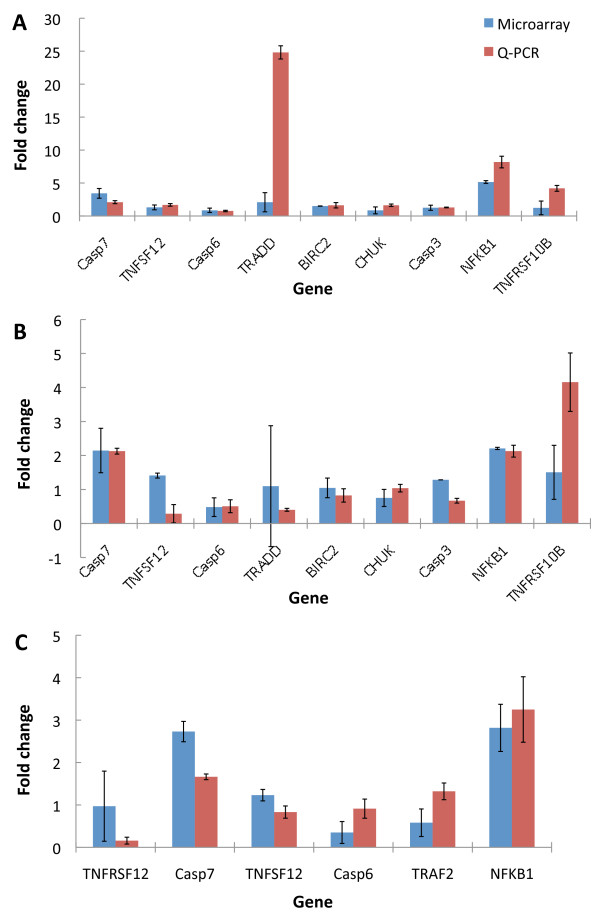
Results: Here, we integrated time-course DNA microarray analysis, quantitative PCR assays, and bioinformatics methods to study the F3-induced effects in THP-1 cells. Significantly disturbed pathways induced by F3 were identified with statistical analysis on microarray data. The apoptosis induction through the DR3 and DR4/5 death receptors was found to be one of the most significant pathways and play a key role in THP-1 cells after F3 treatment. Based on time-course gene expression measurements of the identified pathway, we reconstructed a plausible regulatory network of the involved genes using reverse-engineering computational approach.
Conclusion: Our results showed that F3 may induce death receptor ligands to initiate signaling via receptor oligomerization, recruitment of specialized adaptor proteins and activation of caspase cascades.
Figures

Similar articles
-
Inhibition of migration and induction of apoptosis in LoVo human colon cancer cells by polysaccharides from Ganoderma lucidum.Mol Med Rep. 2015 Nov;12(5):7629-36. doi: 10.3892/mmr.2015.4345. Epub 2015 Sep 22. Mol Med Rep. 2015. PMID: 26397202
-
Reishi polysaccharides induce immunoglobulin production through the TLR4/TLR2-mediated induction of transcription factor Blimp-1.J Biol Chem. 2006 Aug 25;281(34):24111-23. doi: 10.1074/jbc.M601106200. Epub 2006 Jun 23. J Biol Chem. 2006. PMID: 16798741
-
Active lipids of Ganoderma lucidum spores-induced apoptosis in human leukemia THP-1 cells via MAPK and PI3K pathways.J Ethnopharmacol. 2012 Jan 31;139(2):582-9. doi: 10.1016/j.jep.2011.11.055. Epub 2011 Dec 6. J Ethnopharmacol. 2012. PMID: 22172327
-
Ganoderma lucidum targeting lung cancer signaling: A review.Tumour Biol. 2017 Jun;39(6):1010428317707437. doi: 10.1177/1010428317707437. Tumour Biol. 2017. PMID: 28653896 Review.
-
Anti-tumor and immunoregulatory activities of Ganoderma lucidum and its possible mechanisms.Acta Pharmacol Sin. 2004 Nov;25(11):1387-95. Acta Pharmacol Sin. 2004. PMID: 15525457 Review.
Cited by
-
Application of 2,3-naphthalenediamine in labeling natural carbohydrates for capillary electrophoresis.Molecules. 2012 Jun 15;17(6):7387-400. doi: 10.3390/molecules17067387. Molecules. 2012. PMID: 22706370 Free PMC article.
-
Differential Molecular Stress Responses to Low Compared to High Doses of Ionizing Radiation in Normal Human Fibroblasts.Dose Response. 2015 May 4;13(1):dose-response.14-058.Velegzhaninov. doi: 10.2203/dose-response.14-058.Velegzhaninov. eCollection 2015 Jan-Mar. Dose Response. 2015. PMID: 26675169 Free PMC article.
-
DNA Microarray-Based Screening and Characterization of Traditional Chinese Medicine.Microarrays (Basel). 2017 Jan 30;6(1):4. doi: 10.3390/microarrays6010004. Microarrays (Basel). 2017. PMID: 28146102 Free PMC article. Review.
-
Radioresistance, DNA Damage and DNA Repair in Cells With Moderate Overexpression of RPA1.Front Genet. 2020 Jul 31;11:855. doi: 10.3389/fgene.2020.00855. eCollection 2020. Front Genet. 2020. PMID: 32849834 Free PMC article.
-
Changes of signal transductivity and robustness of gene regulatory network in the carcinogenesis of leukemic subtypes via microarray sample data.Oncotarget. 2018 May 4;9(34):23636-23660. doi: 10.18632/oncotarget.25318. eCollection 2018 May 4. Oncotarget. 2018. PMID: 29805763 Free PMC article.
References
-
- Chui CH, Wong RS, Cheng GY, Lau FY, Kok SH, Cheng CH, Cheung F, Tang WK, Teo IT, Chan AS, et al. Antiproliferative ability of a combination regimen of crocodile egg extract, wild radix ginseng and natural Ganoderma lucidum on acute myelogenous leukemia. Oncol Rep. 2006;16:1313–1316. - PubMed
-
- Kashimoto N, Hayama M, Kamiya K, Watanabe H. Inhibitory effect of a water-soluble extract from the culture medium of Ganoderma lucidum (Rei-shi) mycelia on the development of pulmonary adenocarcinoma induced by N-nitrosobis (2-hydroxypropyl) amine in Wistar rats. Oncol Rep. 2006;16:1181–1187. - PubMed
-
- Xie JT, Wang CZ, Wicks S, Yin JJ, Kong J, Li J, Li YC, Yuan CS. Ganoderma lucidum extract inhibits proliferation of SW 480 human colorectal cancer cells. Exp Oncol. 2006;28:25–29. - PubMed
MeSH terms
Substances
LinkOut - more resources
Full Text Sources
Molecular Biology Databases
Miscellaneous
