. 2007 Dec;7(12):3895-900.
doi: 10.1021/nl0724788. Epub 2007 Nov 13.

Electrical detection of fast reaction kinetics in nanochannels with an induced flow

Affiliations

Electrical detection of fast reaction kinetics in nanochannels with an induced flow

Reto B Schoch et al. Nano Lett. 2007 Dec.

Abstract

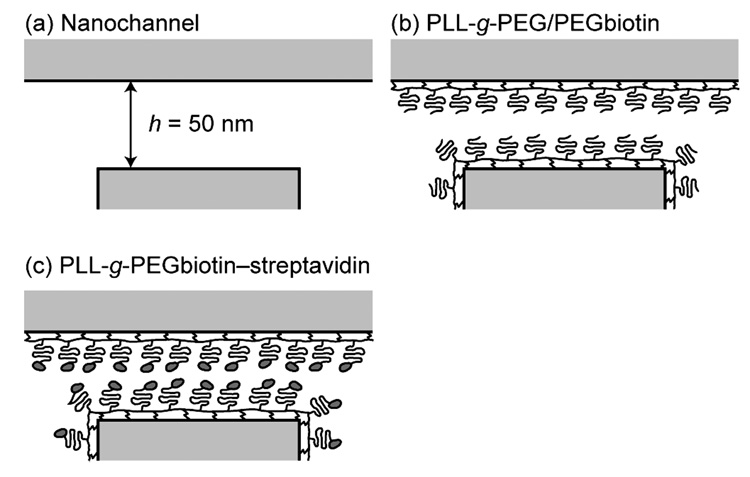
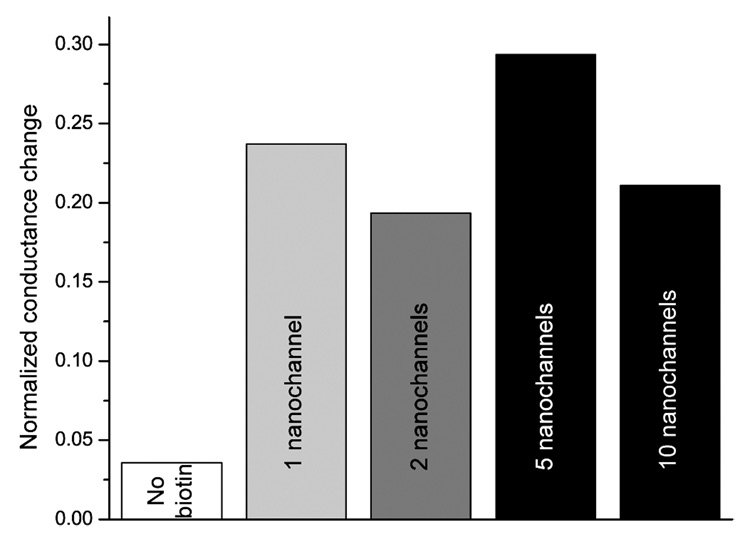
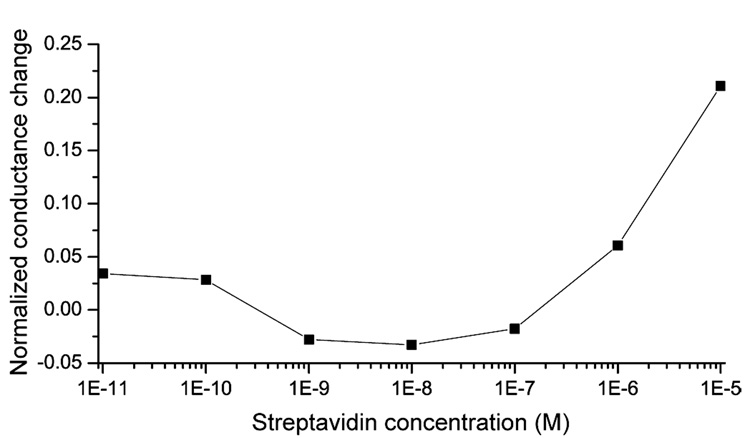
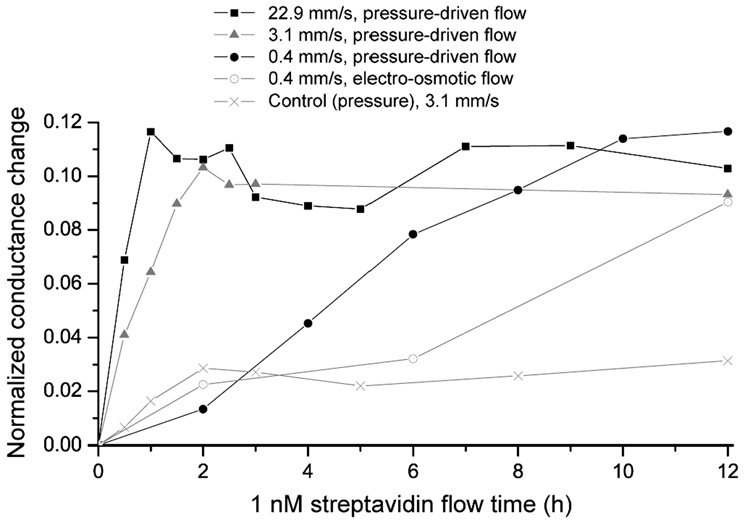
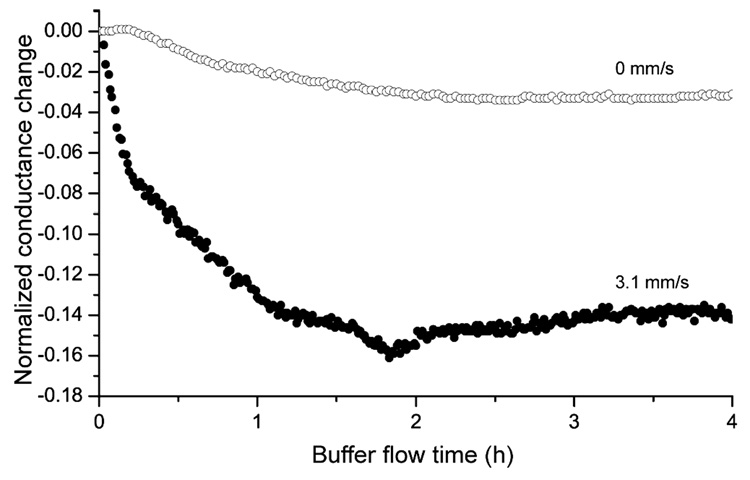
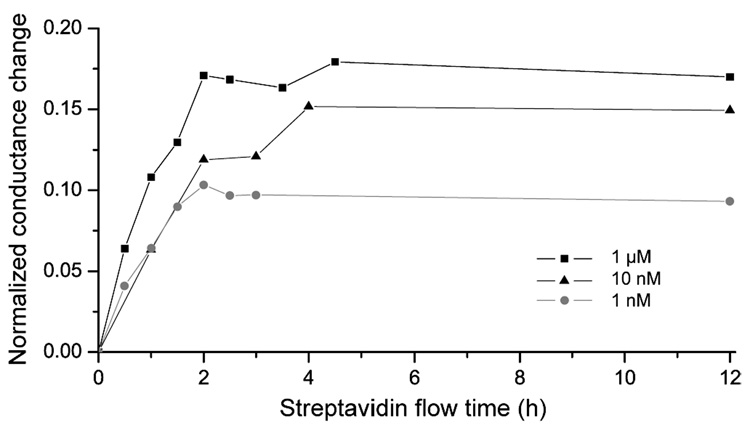
Nanofluidic channels can be used to enhance surface binding reactions, since the target molecules are closely confined to the surfaces that are coated with specific binding partners. Moreover, diffusion-limited binding can be significantly enhanced if the molecules are steered into the nanochannels via either pressure-driven or electrokinetic flow. By monitoring the nanochannel impedance, which is sensitive to surface binding, low analyte concentrations have been detected electrically in nanofluidic channels within response times of 1-2 h. This represents a approximately 54 fold reduction in the response time using convective flow compared to diffusion-limited binding. At high-flow velocities, the presented method of reaction kinetics enhancement is potentially limited by force-induced dissociations of the receptor-ligand bonds. Optimization of this scheme could be useful for label-free, electrical detection of biomolecule binding reactions within nanochannels on a chip.


Figures

Figure 1
Figure 1. Design of the device, consisting of two microchannels joined by nanochannels
(a) Photograph of the 12 × 25 mm chip showing the two microchannels and access holes. The cross-sectional view along the dotted line is presented in (b), a scanning electron microscope image showing two microchannels with electrodes at their bottom, which are connected by nanochannels with height h = 50 nm and length d = 5.5 µm.
Figure 2
Figure 2. Schematic drawing of sequential surface modifications for streptavidin sensing
(a) 50-nm-high nanochannel in Pyrex before surface modification. (b) Channel after coating with PLL-g-PEG/PEGbiotin, which monolayer has a height of ~12 nm., (c) Final assembly after the streptavidin-biotin reaction, which binding can be sensed by a conductance change of the nanochannel.
Figure 3
Figure 3
Difference between the conductance after and before streptavidin binding, divided by the conductance before binding of 10 µM streptavidin using 1 h incubation. The signal change is independent on the numbers of nanochannels. For the control measurement the channels were coated with PLL-g-PEG (no biotin), whereas all other chips were pretreated with PLL-g-PEGbiotin.
Figure 4
Figure 4
Normalized conductance change of the nanochannels as a function of the streptavidin concentration. After 1 h incubation of streptavidin solution, concentrations down to ~0.4 µM can be measured whereas lower streptavidin concentrations were within the repeatability error limit because binding equilibrium has not been reached yet. The connecting lines are for guidance only.
Figure 5
Figure 5
Decrease of the response time of 1 nM streptavidin from ~12 h to ~1 h by increasing the flow velocity through the nanochannel, presented by the normalized conductance change versus streptavidin flow time. The control measurement was made with a 1 nM streptavidin solution and a protein-resistant channel coating under pressure-driven flow. The connecting lines are for guidance only.
Figure 6
Figure 6
Normalized conductance change as a function of buffer flow time at a velocity of ~3.1 mm/s (and 0 mm/s as control measurement). Before the experiment the nanochannels were coated with PLL-g-PEGbiotin and incubated in 10 µM streptavidin solution for 1 h. Applying high buffer flow velocities lead to a signal decrease and equilibrium after ~2 h, showing that the majority of the streptavidin-biotin interactions do not withstand high shear forces.
Figure 7
Figure 7
Reaction kinetics in nanochannels with an induced flow, measured by the normalized conductance change versus analyte flow time for different streptavidin concentrations. The flow velocity of ~3.1 mm/s was equal for all measurements. Dissimilar to standard incubation experiments, in nanochannels the saturation signal changes with the analyte concentration and is reached after equal times of ~2 h. The connecting lines are for guidance only.

Similar articles

Cited by

References

    1. Nair PR, Alam MA. Appl. Phys. Lett. 2006;88:233120.1.
    1. Karnik R, Castelio K, Fan R, Yang P, Majumdar A. Nano Lett. 2005;5:1638. - PubMed
    1. Marie R, Beech JP, Voros J, Tegenfeldt JO, Hook F. Langmuir. 2006;22:10103. - PubMed
    1. Daniels, Jonathan S, Pourmand N. Electroanal. 2007;19:1239. - PMC - PubMed
    1. Mao P, Han J. Lab Chip. 2005;5:837. - PubMed

Publication types