. 2007 Nov;3(11):e204.
doi: 10.1371/journal.pcbi.0030204. Epub 2007 Sep 6.

From inverse problems in mathematical physiology to quantitative differential diagnoses

Affiliations

From inverse problems in mathematical physiology to quantitative differential diagnoses

Sven Zenker et al. PLoS Comput Biol. 2007 Nov.

Erratum in

Abstract

The improved capacity to acquire quantitative data in a clinical setting has generally failed to improve outcomes in acutely ill patients, suggesting a need for advances in computer-supported data interpretation and decision making. In particular, the application of mathematical models of experimentally elucidated physiological mechanisms could augment the interpretation of quantitative, patient-specific information and help to better target therapy. Yet, such models are typically complex and nonlinear, a reality that often precludes the identification of unique parameters and states of the model that best represent available data. Hypothesizing that this non-uniqueness can convey useful information, we implemented a simplified simulation of a common differential diagnostic process (hypotension in an acute care setting), using a combination of a mathematical model of the cardiovascular system, a stochastic measurement model, and Bayesian inference techniques to quantify parameter and state uncertainty. The output of this procedure is a probability density function on the space of model parameters and initial conditions for a particular patient, based on prior population information together with patient-specific clinical observations. We show that multimodal posterior probability density functions arise naturally, even when unimodal and uninformative priors are used. The peaks of these densities correspond to clinically relevant differential diagnoses and can, in the simplified simulation setting, be constrained to a single diagnosis by assimilating additional observations from dynamical interventions (e.g., fluid challenge). We conclude that the ill-posedness of the inverse problem in quantitative physiology is not merely a technical obstacle, but rather reflects clinical reality and, when addressed adequately in the solution process, provides a novel link between mathematically described physiological knowledge and the clinical concept of differential diagnoses. We outline possible steps toward translating this computational approach to the bedside, to supplement today's evidence-based medicine with a quantitatively founded model-based medicine that integrates mechanistic knowledge with patient-specific information.


Conflict of interest statement

Competing interests. The authors have declared that no competing interests exist.

Figures

Figure 1
Figure 1. The Forward and Inverse Problems
Illustration of the role of a mechanistic mathematical model in linking measurements with abstract quantitative representations of the underlying physiological processes. Sources of stochasticity are indicated both for forward/predictive use of the model and inverse/inference use. The forward problem consists of predicting (distributions of) observations if (distributions of) initial conditions and model parameters are known. The inverse problem refers to the task of inferring (distributions of) initial conditions and model parameters from observations. It is termed ill-posed if the available observations are insufficient to define a unique solution.
Figure 2
Figure 2. Schematic of the Simplified Model of the Cardiovascular System and Its Control
Blood is driven from the venous compartment with volume V v to the arterial compartment with volume V a by the monoventricular heart, which contracts from its end-diastolic volume V ED to its end-systolic volume V ES. Reverse flow is prevented by a valve with resistance R valve. To complete the systemic circulation, flow from the arterial to the venous compartment has to overcome the total peripheral resistance R TPR. Baroreflex senses pressure P a in the arterial compartment, and it processes the set point deviation through a sigmoidal nonlinearity and a linear element with low-pass characteristics, eventually affecting the actuators R TPR, unstressed venous volume formula image , heart rate f HR, and myocardial contractility c PRSW. See text for details.
Figure 3
Figure 3. Starling Curves
Steady state stroke volume with inactive baroreflex feedback loop as a function of venous pressure for various contractility factors c that linearly scale the range of the baroreflex contractility effector branch formula image . Simulations were performed by varying total intravascular volume between 3,000 and 8,000 ml and plotting stroke volumes versus venous pressures after 600 s of simulated time.
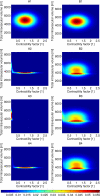
Figure 4
Figure 4. Simulation of Fluid Withdrawal and Reinfusion
Fluid is drawn from or reinfused into the venous compartment at constant rate. Vertical lines indicate the beginning and end of withdrawal and reinfusion.
Figure 5
Figure 5. The Diagnostic Inference Process, Informative Priors
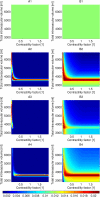
Probability densities for high-precision (standard deviation 10 mm Hg) (A) and low-precision (standard deviation 30 mm Hg) (B) measurements of blood pressure for Gaussian prior densities. (A,B1) show the assumed prior densities, (A,B2) show the posterior densities resulting from a single arterial pressure measurement of 25 mm Hg, (A,B3) show the posterior densities if subsequent to the initial measurement, 1,500 ml of fluid are applied intravenously resulting in a pressure measurement of 30 mm Hg, while (A,B4) show the posterior densities if the measurement after fluid application is 70 mm Hg.
Figure 6
Figure 6. The Diagnostic Inference Process, Uniform Priors
Probability densities for high-precision (standard deviation 10 mm Hg) (A) and low-precision (standard deviation 30 mm Hg) (B) measurements of blood pressure for uniform prior densities. The panel assignments are analogous to Figure 6. Note that the axes are scaled differently due to the narrower support of the (compactly supported) priors used.
Figure 7
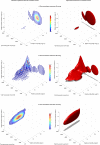
Figure 7. Three-Dimensional Inference
Posterior probability densities for post-resuscitation observations of 30 mm Hg (A), 50 mm Hg (B), and 70 mm Hg (C) mean arterial blood pressure. The left column depicts densities at grid-points corresponding to 95% of the total probability mass, while the right column depicts the approximate surface enclosing this volume. The origin is in the far bottom corner for all figures. Shadows represent orthogonal projections to the contractility/total intravascular volume plane.
Figure 8
Figure 8. Transient Behavior of Continuous Time Cardiac Model
Temporal evolution of actual stroke volume of continuous time system during initial transient of simulation shown in Figure 5 (solid line) and stroke volume calculated from systolic and end-diastolic volumes that would occur if the discrete dynamical system was advanced one step from the current values given by the continuous system (dashed line). Note that the state of the continuous system rapidly approaches a fixed point of the discrete dynamical system, resulting in superposition of the two curves. The transient is caused by starting integration with a non-equilibrium distribution of fluid between arterial and venous compartments.
Figure 9
Figure 9. End-Diastolic Pressure–Volume Relationship
Least squares fit of the empirical exponential pressure–volume relationship used to determine parameters from the experimental end-diastolic measurements from [40], Figure 6, bottom right panel.

Similar articles

Cited by

References

    1. Harvey S, Harrison DA, Singer M, Ashcroft J, Jones CM, et al. Assessment of the clinical effectiveness of pulmonary artery catheters in management of patients in intensive care (PAC-Man): a randomised controlled trial. Lancet. 2005;366:472–477. - PubMed
    1. Shah MR, Hasselblad V, Stevenson LW, Binanay C, O'Connor CM, et al. Impact of the pulmonary artery catheter in critically ill patients: meta-analysis of randomized clinical trials. JAMA. 2005;294:1664–1670. - PubMed
    1. McIntosh N. Intensive care monitoring: past, present and future. Clin Med. 2002;2:349–355. - PMC - PubMed
    1. Kulkarni AV. The challenges of evidence-based medicine: a philosophical perspective. Med Health Care Philos. 2005;8:255–260. - PubMed
    1. Doherty S. Evidence-based medicine: arguments for and against. Emerg Med Australas. 2005;17:307–313. - PubMed

Publication types