

Are there rearrangement hotspots in the human genome?
- PMID: 17997591
- PMCID: PMC2065889
- DOI: 10.1371/journal.pcbi.0030209
Are there rearrangement hotspots in the human genome?
Abstract
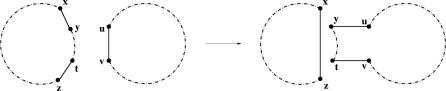
In a landmark paper, Nadeau and Taylor [18] formulated the random breakage model (RBM) of chromosome evolution that postulates that there are no rearrangement hotspots in the human genome. In the next two decades, numerous studies with progressively increasing levels of resolution made RBM the de facto theory of chromosome evolution. Despite the fact that RBM had prophetic prediction power, it was recently refuted by Pevzner and Tesler [4], who introduced the fragile breakage model (FBM), postulating that the human genome is a mosaic of solid regions (with low propensity for rearrangements) and fragile regions (rearrangement hotspots). However, the rebuttal of RBM caused a controversy and led to a split among researchers studying genome evolution. In particular, it remains unclear whether some complex rearrangements (e.g., transpositions) can create an appearance of rearrangement hotspots. We contribute to the ongoing debate by analyzing multi-break rearrangements that break a genome into multiple fragments and further glue them together in a new order. In particular, we demonstrate that (1) even if transpositions were a dominant force in mammalian evolution, the arguments in favor of FBM still stand, and (2) the "gene deletion" argument against FBM is flawed.
Conflict of interest statement
Figures


Similar articles
-
Breaking Good: Accounting for Fragility of Genomic Regions in Rearrangement Distance Estimation.Genome Biol Evol. 2016 May 22;8(5):1427-39. doi: 10.1093/gbe/evw083. Genome Biol Evol. 2016. PMID: 27190002 Free PMC article.
-
The fragile breakage versus random breakage models of chromosome evolution.PLoS Comput Biol. 2006 Feb;2(2):e14. doi: 10.1371/journal.pcbi.0020014. Epub 2006 Feb 24. PLoS Comput Biol. 2006. PMID: 16501665 Free PMC article.
-
Human and mouse genomic sequences reveal extensive breakpoint reuse in mammalian evolution.Proc Natl Acad Sci U S A. 2003 Jun 24;100(13):7672-7. doi: 10.1073/pnas.1330369100. Epub 2003 Jun 16. Proc Natl Acad Sci U S A. 2003. PMID: 12810957 Free PMC article.
-
Chromothripsis and beyond: rapid genome evolution from complex chromosomal rearrangements.Genes Dev. 2013 Dec 1;27(23):2513-30. doi: 10.1101/gad.229559.113. Genes Dev. 2013. PMID: 24298051 Free PMC article. Review.
-
Marsupials as models for understanding the role of chromosome rearrangements in evolution and disease.Chromosoma. 2016 Sep;125(4):633-44. doi: 10.1007/s00412-016-0603-8. Epub 2016 Jun 3. Chromosoma. 2016. PMID: 27255308 Review.
Cited by
-
Genes that are Used Together are More Likely to be Fused Together in Evolution by Mutational Mechanisms: A Bioinformatic Test of the Used-Fused Hypothesis.Evol Biol. 2023;50(1):30-55. doi: 10.1007/s11692-022-09579-9. Epub 2022 Nov 30. Evol Biol. 2023. PMID: 36816837 Free PMC article.
-
The infinite sites model of genome evolution.Proc Natl Acad Sci U S A. 2008 Sep 23;105(38):14254-61. doi: 10.1073/pnas.0805217105. Epub 2008 Sep 11. Proc Natl Acad Sci U S A. 2008. PMID: 18787111 Free PMC article.
-
Anchoring the dog to its relatives reveals new evolutionary breakpoints across 11 species of the Canidae and provides new clues for the role of B chromosomes.Chromosome Res. 2011 Aug;19(6):685-708. doi: 10.1007/s10577-011-9233-4. Epub 2011 Sep 27. Chromosome Res. 2011. PMID: 21947954
-
Breaking Good: Accounting for Fragility of Genomic Regions in Rearrangement Distance Estimation.Genome Biol Evol. 2016 May 22;8(5):1427-39. doi: 10.1093/gbe/evw083. Genome Biol Evol. 2016. PMID: 27190002 Free PMC article.
-
The elusive evidence for chromothripsis.Nucleic Acids Res. 2014 Jul;42(13):8231-42. doi: 10.1093/nar/gku525. Epub 2014 Jun 17. Nucleic Acids Res. 2014. PMID: 24939897 Free PMC article.
References
-
- Ohno S. Evolution by gene duplication. Berlin: Springer; 1970. 160
-
- Kellis M, Birren BW, Lander ES. Proof and evolutionary analysis of ancient genome duplication in the yeast Saccharomyces cerevisiae . Nature. 2004;428:617–624. - PubMed
-
- Dietrich FS, Voegeli S, Brachat S, Lerch A, Gates K, et al. The Ashbya gossypii genome as a tool for mapping the ancient Saccharomyces cerevisiae genome. Science. 2004;304:304–307. - PubMed
-
- Hannenhalli S, Pevzner P. Proceedings of the 36th Annual Symposium on Foundations of Computer Science. Washington (D.C.): IEEE Computer Society; 1995. Transforming men into mouse (polynomial algorithm for genomic distance problem) pp. 581–592.
MeSH terms
LinkOut - more resources
Full Text Sources
