. 2007 Nov;3(11):e215.
doi: 10.1371/journal.pcbi.0030215. Epub 2007 Sep 24.

A nucleosome-guided map of transcription factor binding sites in yeast

Affiliations

A nucleosome-guided map of transcription factor binding sites in yeast

Leelavati Narlikar et al. PLoS Comput Biol. 2007 Nov.

Abstract

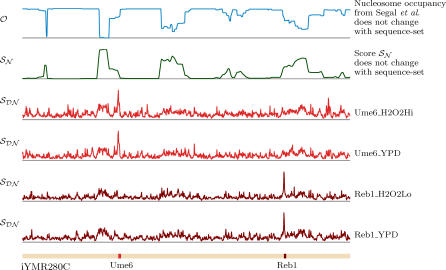
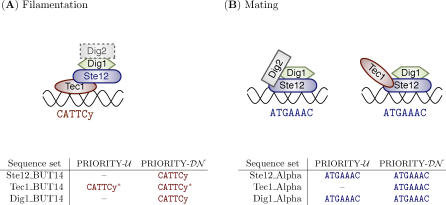
Finding functional DNA binding sites of transcription factors (TFs) throughout the genome is a crucial step in understanding transcriptional regulation. Unfortunately, these binding sites are typically short and degenerate, posing a significant statistical challenge: many more matches to known TF motifs occur in the genome than are actually functional. However, information about chromatin structure may help to identify the functional sites. In particular, it has been shown that active regulatory regions are usually depleted of nucleosomes, thereby enabling TFs to bind DNA in those regions. Here, we describe a novel motif discovery algorithm that employs an informative prior over DNA sequence positions based on a discriminative view of nucleosome occupancy. When a Gibbs sampling algorithm is applied to yeast sequence-sets identified by ChIP-chip, the correct motif is found in 52% more cases with our informative prior than with the commonly used uniform prior. This is the first demonstration that nucleosome occupancy information can be used to improve motif discovery. The improvement is dramatic, even though we are using only a statistical model to predict nucleosome occupancy; we expect our results to improve further as high-resolution genome-wide experimental nucleosome occupancy data becomes increasingly available.


Conflict of interest statement

Competing interests. The authors have declared that no competing interests exist.

Figures

Figure 1
Figure 1. Steps in the Derivation of the Nucleosome Scores S℘N℘ and S℘D℘N℘
(1) Obtain the sets of bound and unbound sequences ({X 1,X 2,…,X n) and {Y 1,Y 2,…,Y m}, respectively) from a ChIP-chip experiment for a particular TF ((inidcated by a diamond). (2) Determine the nucleosome occupancy O℘ for all the bound and the unbound sequences. (3A) Compute the simple nucleosome score S℘N℘(X i, j) for each W-mer starting at position j in the bound sequence X i by averaging the accessibility (1 − O℘) over all positions in the W-mer. (3B) Compute the discriminative nucleosome score S℘D℘ N℘(X i, j) for each W-mer starting at position j in sequence X i, using the accessibility (1 − O℘) over all occurrences of this W-mer in both the bound and the unbound sequences (see Materials and Methods for details). All the sequences and scores depicted in this figure correspond to the TF Reb1 profiled in YPD and use occupancy predictions from the computational model of Segal et al. The black boxes on the bound DNA sequences indicate matches to the Reb1 motif.
Figure 2
Figure 2. Performance of the Three Positional Priors
A dark orange (light grey) square in each column indicates the situation where the respective prior succeeds (fails) in finding the true motif. There are 23 = 8 possible combinations of successes or failures for the three priors. These are represented by the eight columns, which are ordered based on the success or failure of PRIORITY-D℘N℘. The number of sequence-sets (out of the total 156 sequence-sets) falling into each category is indicated below the respective column.
Figure 3
Figure 3. Distribution of S℘N℘, S℘D℘ N℘, and S℘D℘ N℘  in the Sequence-Set for Leu3 Profiled in YPD
The distribution of scores over each unique 10-mer occurring in the Leu3_YPD sequence-set shown as a percentile plot (on the left) and as a histogram (on the right) computed according to: (A) S℘N℘ (averaged over each 10-mer) using predictions from computational model of Segal et al., (B) S℘D℘ N℘ using predictions from computational model of Segal et al., and (C) S℘D℘ N℘  using low-resolution nucleosome data from Lee et al. The three colored dots marked on each figure indicate the positions of the only three 10-mers matching the Leu3 motif CCGGNNCCGG present in Leu3_YPD. The red dot corresponds to CCGGTACCGG (see text). The mass to the right of the dots in each graph reveals the fraction of 10-mers scoring higher.
Figure 4
Figure 4. Nucleosome Occupancy and the Values of S℘D℘ N℘ over Four Intergenic Sequences
(A) iYDR190C in Cbf1_SM, (B) iYAR007C in Mbp1_H2O2Hi, (C) YJLWdelta16 in Gcr1_YPD, and (D) iYBR043C in Gcn4_YPD. The boxes indicate binding sites annotated by Harbison et al. [2]. S℘D℘ N℘ at the locations of each of these binding sites has a high value relative to the rest of the sequence regardless of the S℘N℘ score at those sites. In particular, in spite of the low accessibility at the binding sites of Gcr1 (in YJLWdelta16) and Gcn4 (in iYBR043C), S℘D℘ N℘ correctly indicates a high prior probability at those regions.
Figure 5
Figure 5. S℘D℘ N℘ over a Single Sequence Belonging to Multiple Sequence-Sets
The intergenic region iYMR280C belongs to four sequence-sets: Ume6_H2O2Hi, Ume6_YPD, Reb1_H2O2Lo, and Reb1_YPD. The boxes indicate binding sites annotated by Harbison et al. [2]. S℘D℘ N℘ for each sequence-set is different although S℘N℘ does not change. S℘D℘ N℘ indicates correctly the location of the binding site of the respective TF.
Figure 6
Figure 6. Transcriptional Complexes Involving Ste12, Tec1, and Dig1
(A) During filamentation, Ste12 forms a complex with Dig1 and Tec1. Tec1 binds DNA, with a sequence specificity for CATTCy. PRIORITY-D℘N℘ finds this motif in all three sequence-sets pulled down by Ste12, Tec1, and Dig1 after the cells are treated with butanol. However, PRIORITY-U℘ misses the functional Tec1 motif in Ste12_BUT14 and Dig1_BUT14. The asterisk indicates that the learned motif is a weak match. (B) During mating, Ste12 forms two complexes: one with Dig1 and Dig2, and another with Dig1 and Tec1. In either case, it is Ste12 that binds DNA, with a sequence specificity for ATGAAAC. Again, PRIORITY-D℘N℘ finds this motif in all three sequence-sets pulled down by Ste12, Tec1, and Dig1 after the cells are treated with the alpha factor pheromone. Here, PRIORITY-U℘ fails to find the Ste12 motif in Tec1_Alpha. (Figures of the complexes are adapted from Chou et al. [25].)

References

    1. Ren B, Robert F, Wyrick J, Aparicio O, Jennings E, et al. Genome-wide location and function of DNA binding proteins. Science. 2000;290:2306–2309. - PubMed
    1. Harbison C, Gordon D, Lee T, Rinaldi N, MacIsaac K, et al. Transcriptional regulatory code of a eukaryotic genome. Nature. 2004;431:99–104. - PMC - PubMed
    1. Liu X, Noll D, Lieb J, Clarke N. DIP-chip: Rapid and accurate determination of DNA binding specificity. Genome Res. 2005;15:421–427. - PMC - PubMed
    1. Mukherjee S, Berger M, Jona G, Wang X, Muzzey D, et al. Rapid analysis of the DNA binding specificities of transcription factors with DNA microarrays. Nat Genet. 2004;36:1331–1339. - PMC - PubMed
    1. Spellman P, Sherlock G, Zhang M, Iyer V, Anders K, et al. Comprehensive identification of cell cycle-regulated genes of the yeast Saccharomyces cerevisiae by microarray hybridization. Mol Biol Cell. 1998;9:3273–3297. - PMC - PubMed

Publication types

MeSH terms

LinkOut - more resources