. 2007 Nov;3(11):e225.
doi: 10.1371/journal.pcbi.0030225.

Genetic progression and the waiting time to cancer

Affiliations

Genetic progression and the waiting time to cancer

Niko Beerenwinkel et al. PLoS Comput Biol. 2007 Nov.

Abstract

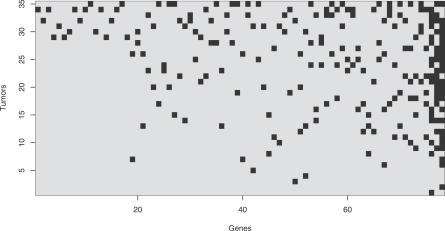
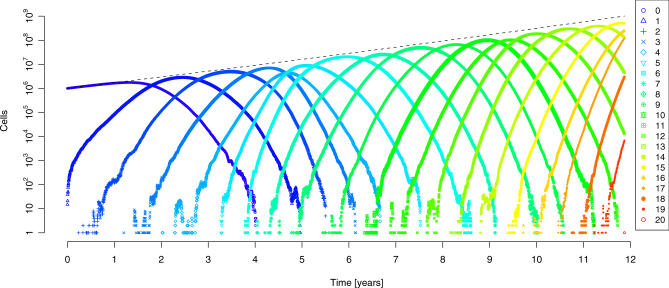
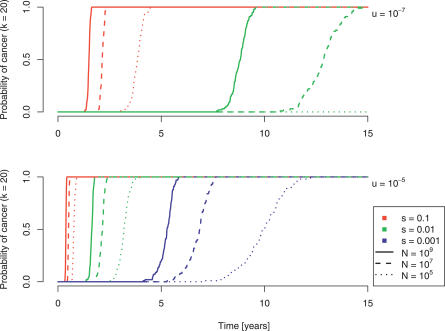
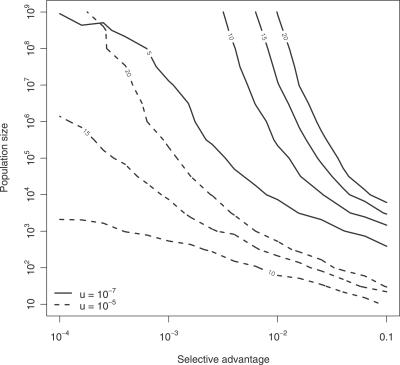
Cancer results from genetic alterations that disturb the normal cooperative behavior of cells. Recent high-throughput genomic studies of cancer cells have shown that the mutational landscape of cancer is complex and that individual cancers may evolve through mutations in as many as 20 different cancer-associated genes. We use data published by Sjöblom et al. (2006) to develop a new mathematical model for the somatic evolution of colorectal cancers. We employ the Wright-Fisher process for exploring the basic parameters of this evolutionary process and derive an analytical approximation for the expected waiting time to the cancer phenotype. Our results highlight the relative importance of selection over both the size of the cell population at risk and the mutation rate. The model predicts that the observed genetic diversity of cancer genomes can arise under a normal mutation rate if the average selective advantage per mutation is on the order of 1%. Increased mutation rates due to genetic instability would allow even smaller selective advantages during tumorigenesis. The complexity of cancer progression can be understood as the result of multiple sequential mutations, each of which has a relatively small but positive effect on net cell growth.


Conflict of interest statement

Competing interests. The authors have declared that no competing interests exist.

Figures

Figure 1
Figure 1. Schematic Representation of the Evolution of Cancer in a Colonic Adenoma
The adenoma grows from a population of 106 to 109 cells which accumulate mutations that drive phenotypic changes seen in cancer cells. Blue circles symbolize adenoma cells prior to accumulating the additional mutations that are the subject of modeling, green indicates cells that have acquired additional, but an insufficient number of mutations for malignancy, and red indicates cells with the number of mutations required for the cancer phenotype.
Figure 2
Figure 2. Mutational Patterns in 35 Late-Stage Colorectal Cancer Tumors from Sjöblom et al. (2006)
Matrix rows are indexed by tumors, columns are indexed by cancer-associated genes as identified by Sjöblom et al. (2006). Dark spots indicate mutated genes. Both tumors and genes have been sorted by an increasing number of mutations. The three genes mutated most often are APC (in 24 tumors; last column), p53 (in 17 tumors; penultimate column), and K-ras (in 16 tumors; adjacent to p53 column).
Figure 3
Figure 3. Evolution of Cancer Modeled by the Wright-Fisher Process
The distribution of cells in the error classes N 0, …, N 20 is displayed in a single simulation over a time period of 12 years after which the first cell harboring 20 mutations appears. The total population size (dashed line) grows exponentially from 106 to 109 cells in this time period. Each cell has 100 susceptible genes, all of which are of wild-type initially. We further assumed a mutation rate of 10−7 per gene, a 1% selective advantage per mutation, and a turnover of 1 cell division per cell per day. Each error class has an approximately Gaussian distribution (after a short initial phase), but the introduction of each new mutant is subject to stochastic fluctuations.
Figure 4
Figure 4. The Probability of Developing Cancer, Defined as the Occurrence of a Cell with Any 20 Mutated Genes Out of 100
Simulation results are displayed for three different population sizes (109, solid lines; 107, dashed lines; 105, dotted lines), three different selection coefficients (10%, red lines; 1%, green lines; 0.1%, blue lines), and two different mutation rates (10−7, top; 10−5, bottom).
Figure 5
Figure 5. Level Curves of Identical Cancer Dynamics
Each curve connects points in parameter space (x-axis: selective advantage s, y-axis: population size N) with the same evolutionary outcome, namely a 10% chance of developing a k-fold mutant after 8.2 years (or 3,000 generations). The mutation rate is 10−7 (solid lines) and 10−5 (dashed lines), respectively. Curves are labeled with the number k of mutated genes that defines the cancer phenotype.

Similar articles

Cited by

References

    1. Vogelstein B, Kinzler KW. Cancer genes and the pathways they control. Nat Med. 2004;10:789–799. - PubMed
    1. Hanahan D, Weinberg RA. The hallmarks of cancer. Cell. 2000;100:57–70. - PubMed
    1. Knudson AG. Cancer genetics. Am J Med Genet. 2002;111:96–102. - PubMed
    1. Luebeck EG, Moolgavkar SH. Multistage carcinogenesis and the incidence of colorectal cancer. Proc Natl Acad Sci U S A. 2002;99:15095–15100. - PMC - PubMed
    1. Rajagopalan H, Nowak MA, Vogelstein B, Lengauer C. The significance of unstable chromosomes in colorectal cancer. Nat Rev Cancer. 2003;3:695–701. - PubMed

Publication types