

A point mutation in a herpesvirus polymerase determines neuropathogenicity
- PMID: 17997600
- PMCID: PMC2065875
- DOI: 10.1371/journal.ppat.0030160
A point mutation in a herpesvirus polymerase determines neuropathogenicity
Abstract
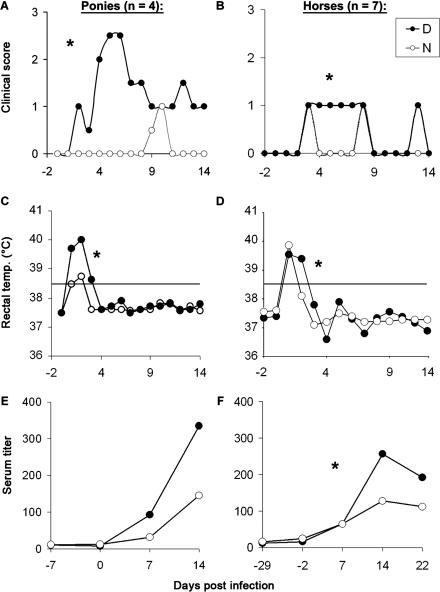
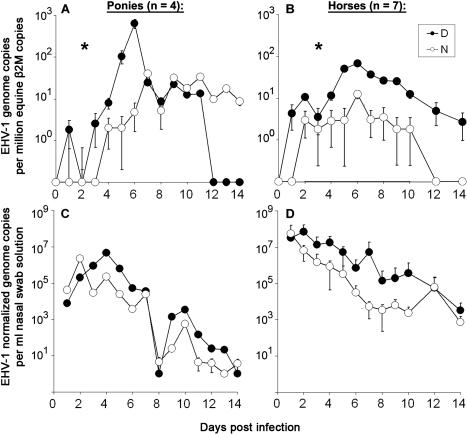
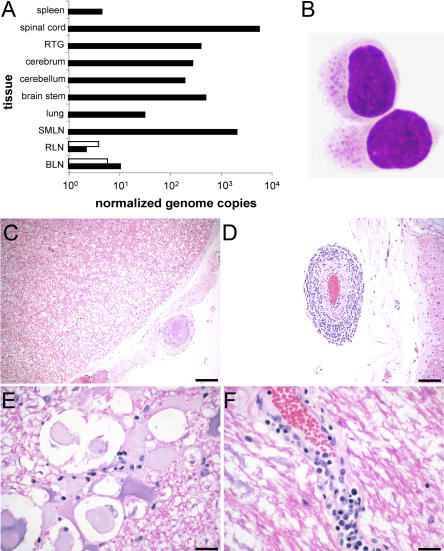
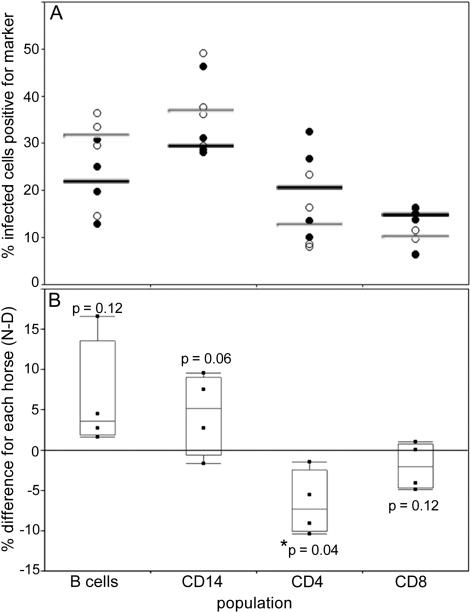
Infection with equid herpesvirus type 1 (EHV-1) leads to respiratory disease, abortion, and neurologic disorders in horses. Molecular epidemiology studies have demonstrated that a single nucleotide polymorphism resulting in an amino acid variation of the EHV-1 DNA polymerase (N752/D752) is significantly associated with the neuropathogenic potential of naturally occurring strains. To test the hypothesis that this single amino acid exchange by itself influences neuropathogenicity, we generated recombinant viruses with differing polymerase sequences. Here we show that the N752 mutant virus caused no neurologic signs in the natural host, while the D752 virus was able to cause inflammation of the central nervous system and ataxia. Neurologic disease induced by the D752 virus was concomitant with significantly increased levels of viremia (p = 0.01), but the magnitude of virus shedding from the nasal mucosa was similar between the N752 and D752 viruses. Both viruses replicated with similar kinetics in fibroblasts and epithelial cells, but exhibited differences in leukocyte tropism. Last, we observed a significant increase (p < 0.001) in sensitivity of the N752 mutant to aphidicolin, a drug targeting the viral polymerase. Our results demonstrate that a single amino acid variation in a herpesvirus enzyme can influence neuropathogenic potential without having a major effect on virus shedding from infected animals, which is important for horizontal spread in a population. This observation is very interesting from an evolutionary standpoint and is consistent with data indicating that the N752 DNA pol genotype is predominant in the EHV-1 population, suggesting that decreased viral pathogenicity in the natural host might not be at the expense of less efficient inter-individual transmission.
Conflict of interest statement
Figures
Similar articles
-
Residue 752 in DNA polymerase of equine herpesvirus type 1 is non-essential for virus growth in vitro.J Gen Virol. 2010 Jul;91(Pt 7):1817-22. doi: 10.1099/vir.0.018036-0. Epub 2010 Mar 3. J Gen Virol. 2010. PMID: 20200193
-
Attenuation of the neuropathogenic equine herpesvirus type 1 strain Ab4p in hamsters by a single amino acid mutation (D752N) in viral DNA polymerase ORF30.J Vet Med Sci. 2024 Dec 1;86(12):1273-1278. doi: 10.1292/jvms.24-0338. Epub 2024 Oct 9. J Vet Med Sci. 2024. PMID: 39384384 Free PMC article.
-
Identification of a New Equid Herpesvirus 1 DNA Polymerase (ORF30) Genotype with the Isolation of a C2254/H752 Strain in French Horses Showing no Major Impact on the Strain Behaviour.Viruses. 2020 Oct 13;12(10):1160. doi: 10.3390/v12101160. Viruses. 2020. PMID: 33066315 Free PMC article.
-
Comparison of the pathogenesis of acute equine herpesvirus 1 (EHV-1) infection in the horse and the mouse model: a review.Vet Microbiol. 1999 Aug 16;68(1-2):3-13. doi: 10.1016/s0378-1135(99)00056-5. Vet Microbiol. 1999. PMID: 10501157 Review.
-
A review of equid herpesvirus 1 for the veterinary practitioner. Part A: clinical presentation, diagnosis and treatment.N Z Vet J. 2014 Jul;62(4):171-8. doi: 10.1080/00480169.2014.899945. N Z Vet J. 2014. PMID: 24597778 Review.
Cited by
-
Detection of the neuropathogenic variant of equine herpesvirus 1 associated with abortions in mares in Poland.BMC Vet Res. 2015 May 1;11:102. doi: 10.1186/s12917-015-0416-7. BMC Vet Res. 2015. PMID: 25929692 Free PMC article.
-
Equine herpesvirus-1, non-neurogenic pathotype, in a 9-year-old American Saddlebred with neurological signs.Can Vet J. 2009 Mar;50(3):297-300. Can Vet J. 2009. PMID: 19436483 Free PMC article.
-
Modulation of Equid Herpesvirus-1 Replication Dynamics In Vitro Using CRISPR/Cas9-Assisted Genome Editing.Viruses. 2024 Mar 6;16(3):409. doi: 10.3390/v16030409. Viruses. 2024. PMID: 38543774 Free PMC article.
-
Whole genome sequencing of Herpes Simplex Virus 1 directly from human cerebrospinal fluid reveals selective constraints in neurotropic viruses.Virus Evol. 2020 Feb 20;6(1):veaa012. doi: 10.1093/ve/veaa012. eCollection 2020 Jan. Virus Evol. 2020. PMID: 32099667 Free PMC article.
-
Pharmacokinetics of ganciclovir and valganciclovir in the adult horse.J Vet Pharmacol Ther. 2013 Oct;36(5):441-9. doi: 10.1111/jvp.12029. Epub 2013 Jan 10. J Vet Pharmacol Ther. 2013. PMID: 23301502 Free PMC article.
References
-
- USDA-APHIS. Equine herpes virus myeloencephalopathy: A potentially emerging disease. 2007. Available: http://www.aphis.usda.gov/vs/ceah/cei/taf/emergingdiseasenotice_files/eh.... Accessed 04 June 2007.
-
- Kydd JH, Smith KC, Hannant D, Livesay GJ, Mumford JA. Distribution of equid herpesvirus-1 (EHV-1) in respiratory tract associated lymphoid tissue: Implications for cellular immunity. Equine Vet J. 1994;26:470–473. - PubMed
-
- Allen GP, Bryans JT. Molecular epizootiology, pathogenesis, and prophylaxis of equine herpesvirus-1 infections. Prog Vet Microbiol Immunol. 1986;2:78–144. - PubMed
-
- Edington N, Bridges CG, Patel JR. Endothelial cell infection and thrombosis in paralysis caused by equid herpesvirus-1: Equine stroke. Arch Virol. 1986;90:111–124. - PubMed
Publication types
MeSH terms
Substances
Associated data
- Actions
- Actions
- Actions
- Actions
Grants and funding
LinkOut - more resources
Full Text Sources
Other Literature Sources
