

Sensitivity of mice to lipopolysaccharide is increased by a high saturated fat and cholesterol diet
- PMID: 17997851
- PMCID: PMC2186306
- DOI: 10.1186/1476-9255-4-22
Sensitivity of mice to lipopolysaccharide is increased by a high saturated fat and cholesterol diet
Abstract
Background: It was hypothesized that a pro-atherogenic, high saturated fat and cholesterol diet (HCD) would increase the inflammatory response to E. coli endotoxin (LPS) and increase its concentration in plasma after administration to mice.
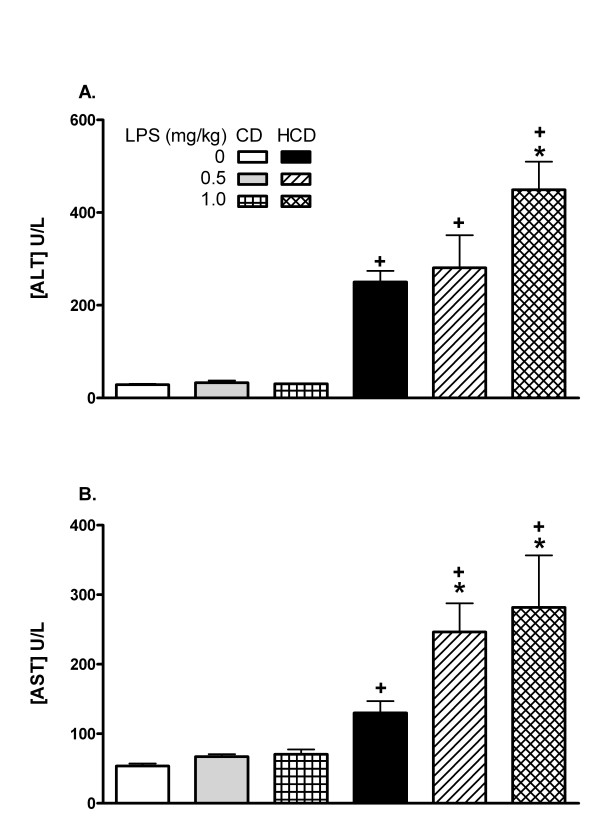
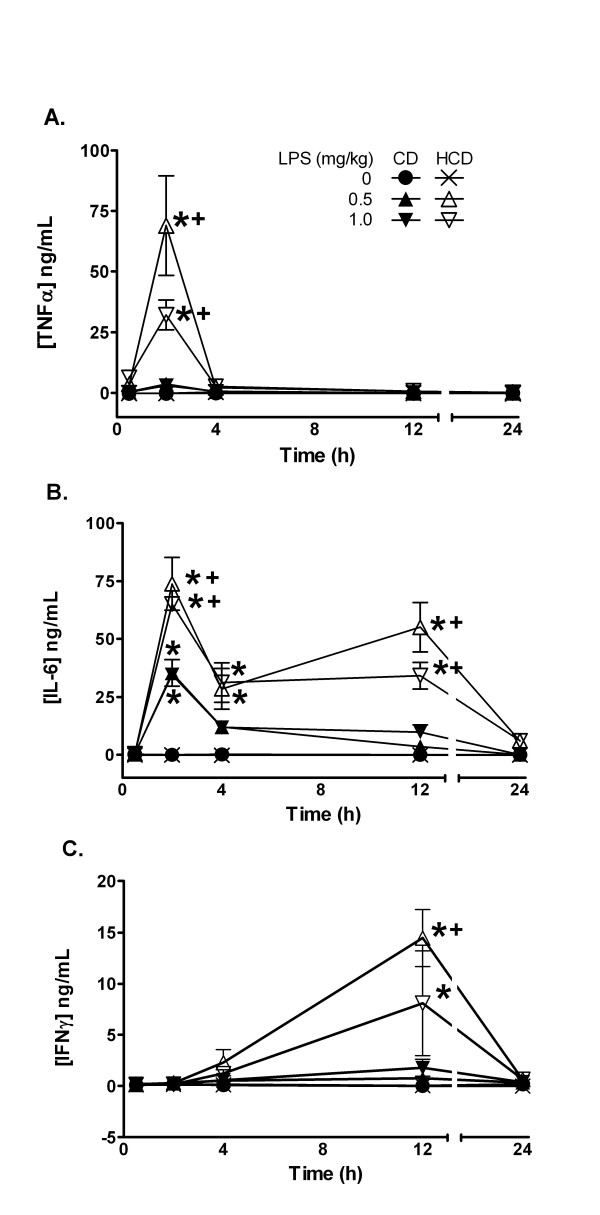
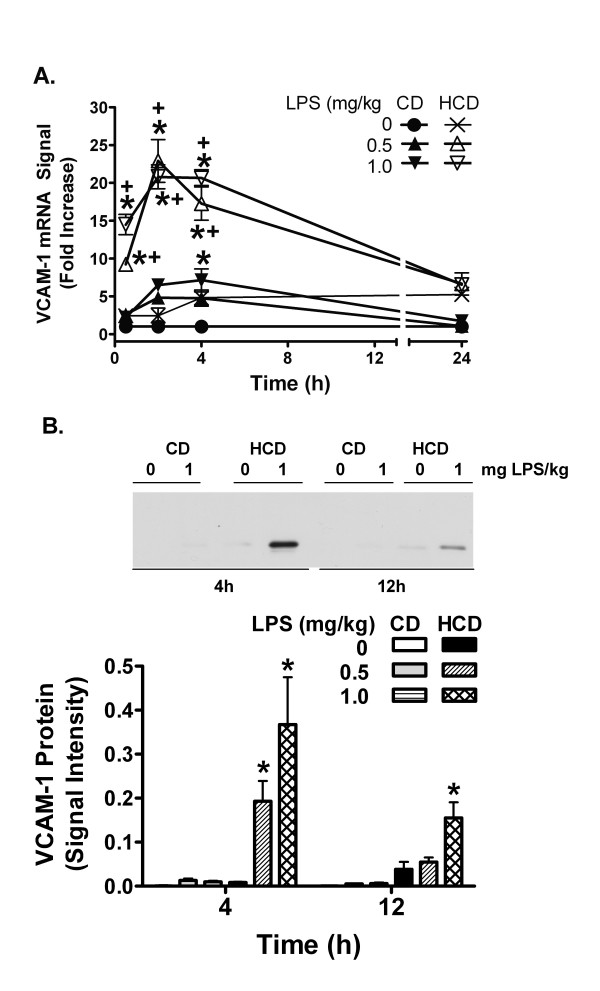
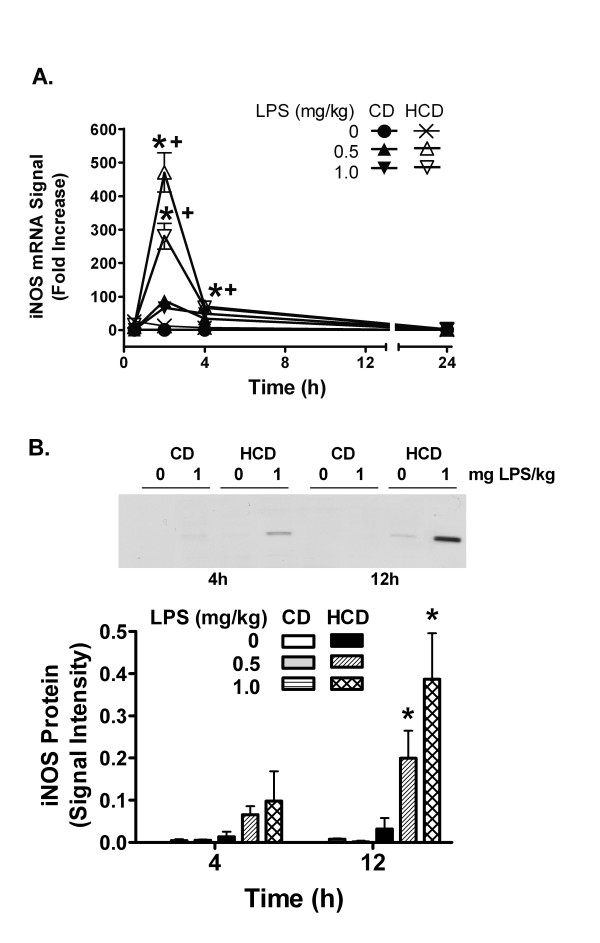
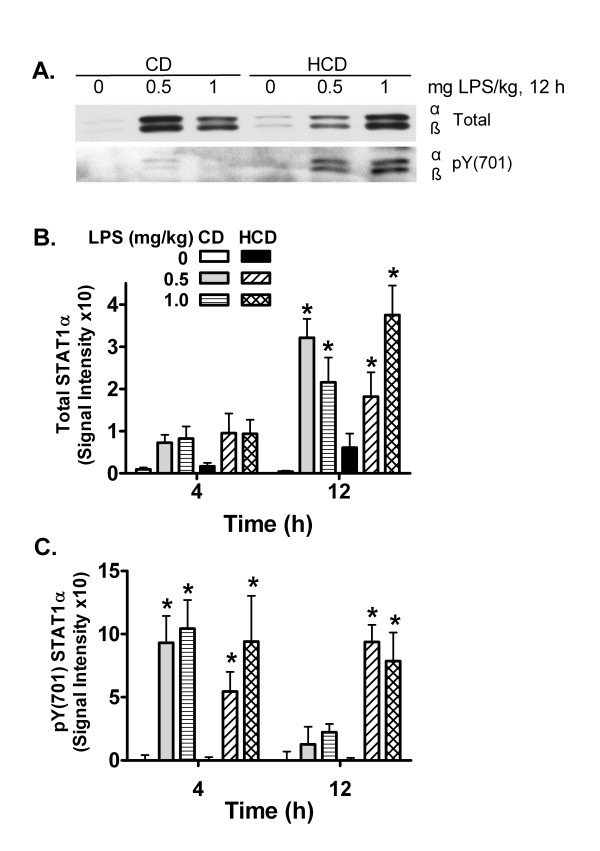
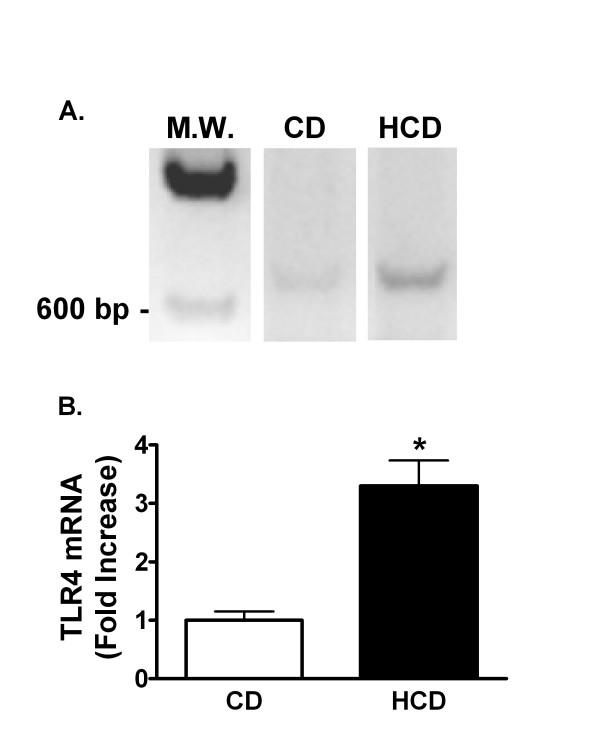
Methods: C57Bl/6 mice were fed a HCD or a control diet (CD) for 4 weeks, and then treated with saline, 0.5, 1 or 2 mg LPS/kg, ip. Liver injury (alanine:2-oxoglutarate aminotransferase and aspartate aminotransferase, collagen staining), circulating cytokines (tumor necrosis factor-alpha, interleukin-6 and interferon-gamma), factors that can bind LPS (serum amyloid A, apolipoprotein A1, LPS binding protein, and CD14), and plasma levels of LPS were measured. The hepatic response was assessed by measuring vascular cell adhesion molecule (VCAM)-1, inducible nitric oxide synthase (iNOS) and signal transducer and activator of transcription-1 proteins, and VCAM-1 and iNOS mRNAs. Hepatic mRNA encoding the LPS receptor, Toll like receptor 4, was also determined.
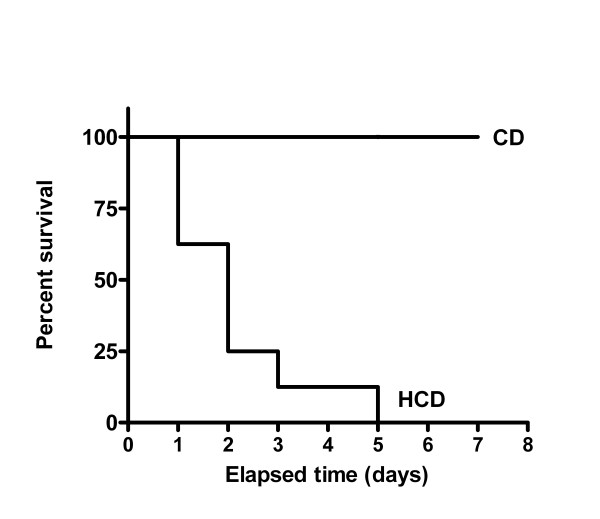
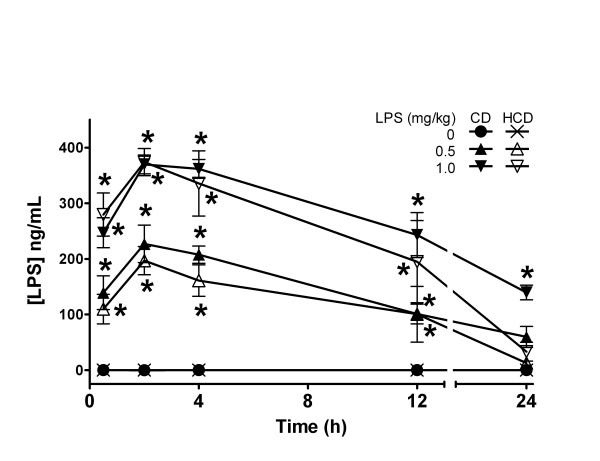
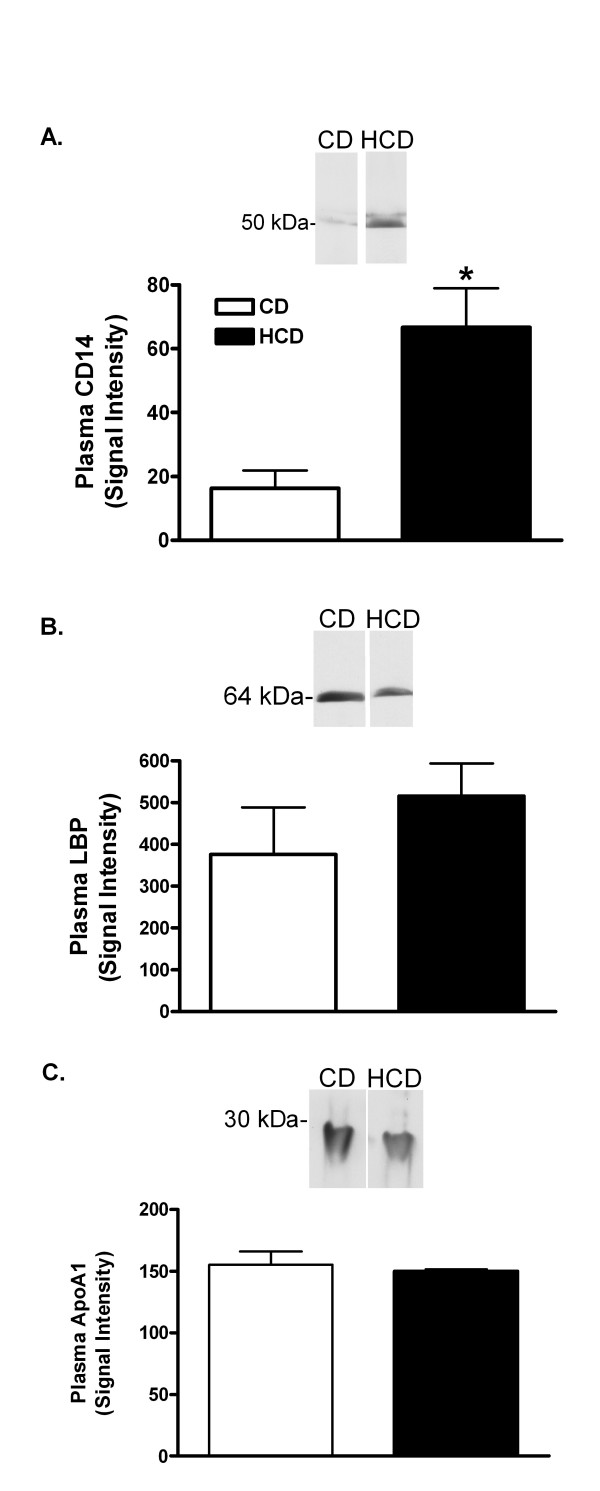
Results: Two mg LPS/kg killed 100% of mice fed HCD within 5 d, while no mice fed CD died. All mice treated with 0 to 1 mg LPS/kg survived 24 h. HCD increased plasma alanine:2-oxoglutarate aminotransferase and aspartate aminotransferase, and the enzymes were increased more by LPS in HCD than CD mice. Induction of plasma tumor necrosis factor-alpha, interleukin-6, and interferon-gamma by LPS was greater with HCD than CD. Hepatic VCAM-1 and iNOS protein and mRNA were induced by LPS more in mice fed HCD than CD. Tyrosine phosphorylation of signal transducer and activator of transcription-1 caused by LPS was prolonged in HCD compared with CD mice. Despite the hepatic effects of HCD, diet had no effect on the LPS plasma concentration-time profile. HCD alone did not affect circulating levels of plasma apolipoprotein A1 or LPS binding protein. However, plasma concentrations of serum amyloid A and CD14, and hepatic toll-like receptor-4 mRNA were increased in mice fed HCD.
Conclusion: HCD increased the sensitivity of mice to LPS without affecting its plasma level. Although increased serum amyloid A and CD14 in the circulation may inhibit LPS actions, their overexpression, along with hepatic toll-like receptor-4 or other factors, may contribute to the heightened sensitivity to LPS.
Figures
Similar articles
-
Increased lipopolysaccharide sensitivity in alcoholic fatty livers is independent of leptin deficiency and toll-like receptor 4 (TLR4) or TLR2 mRNA expression.Alcohol Clin Exp Res. 2005 Jun;29(6):1018-26. doi: 10.1097/01.alc.0000167744.60838.4a. Alcohol Clin Exp Res. 2005. PMID: 15976528
-
[Inhibitory effects of Kukoamine B on the inflammatory response of small intestine in lipopolysaccharide-induced septic mice and its potential mechanisms].Zhonghua Wei Zhong Bing Ji Jiu Yi Xue. 2015 Feb;27(2):121-6. doi: 10.3760/cma.j.issn.2095-4352.2015.02.009. Zhonghua Wei Zhong Bing Ji Jiu Yi Xue. 2015. PMID: 25665611 Chinese.
-
Lipopolysaccharide-induced down-regulation of organic anion transporting polypeptide 4 (Oatp4; Slc21a10) is independent of tumor necrosis factor-alpha, Interleukin-1beta, interleukin-6, or inducible nitric oxide synthase.Toxicol Sci. 2005 Jan;83(1):197-203. doi: 10.1093/toxsci/kfi003. Epub 2004 Oct 13. Toxicol Sci. 2005. PMID: 15483191
-
Monascin and ankaflavin act as natural AMPK activators with PPARα agonist activity to down-regulate nonalcoholic steatohepatitis in high-fat diet-fed C57BL/6 mice.Food Chem Toxicol. 2014 Feb;64:94-103. doi: 10.1016/j.fct.2013.11.015. Epub 2013 Nov 22. Food Chem Toxicol. 2014. PMID: 24275089
-
Decoding cell death signals in liver inflammation.J Hepatol. 2013 Sep;59(3):583-94. doi: 10.1016/j.jhep.2013.03.033. Epub 2013 Apr 6. J Hepatol. 2013. PMID: 23567086 Review.
Cited by
-
IκB Kinase Inhibitor VII Modulates Sepsis-Induced Excessive Inflammation and Cardiac Dysfunction in 5/6 Nephrectomized Mice.Mediators Inflamm. 2020 Sep 10;2020:4251682. doi: 10.1155/2020/4251682. eCollection 2020. Mediators Inflamm. 2020. PMID: 32963493 Free PMC article.
-
Metabolic Endotoxemia: A Potential Underlying Mechanism of the Relationship between Dietary Fat Intake and Risk for Cognitive Impairments in Humans?Nutrients. 2019 Aug 13;11(8):1887. doi: 10.3390/nu11081887. Nutrients. 2019. PMID: 31412673 Free PMC article. Review.
-
Neuroprotection by Preconditioning in Mice is Dependent on MyD88-Mediated CXCL10 Expression in Endothelial Cells.ASN Neuro. 2023 Jan-Dec;15:17590914221146365. doi: 10.1177/17590914221146365. ASN Neuro. 2023. PMID: 36591943 Free PMC article.
-
Dietary Toll-Like Receptor Stimulants Promote Hepatic Inflammation and Impair Reverse Cholesterol Transport in Mice via Macrophage-Dependent Interleukin-1 Production.Front Immunol. 2019 Jun 20;10:1404. doi: 10.3389/fimmu.2019.01404. eCollection 2019. Front Immunol. 2019. PMID: 31316501 Free PMC article.
-
Maternal Nutritional Programming: Sex-Specific Cardiovascular and Immune Outcomes Following Perinatal High-Fat Diet Exposure.Nutrients. 2025 Apr 26;17(9):1464. doi: 10.3390/nu17091464. Nutrients. 2025. PMID: 40362773 Free PMC article.
References
-
- Darlington GJ, Wilson DR, Revel M, Kelly JH. Response of liver genes to acute phase mediators. Ann N Y Acad Sci. 1989;557:310–5; discussion 315-6. - PubMed
-
- Shimada H, Hasegawa N, Koh H, Tasaka S, Shimizu M, Yamada W, Nishimura T, Amakawa K, Kohno M, Sawafuji M, Nakamura K, Fujishima S, Yamaguchi K, Ishizaka A. Effects of initial passage of endotoxin through the liver on the extent of acute lung injury in a rat model. Shock. 2006;26:311–315. doi: 10.1097/01.shk.0000224960.17274.6f. - DOI - PubMed
-
- Berbee JF, Havekes LM, Rensen PC. Apolipoproteins modulate the inflammatory response to lipopolysaccharide. J Endotoxin Res. 2005;11:97–103. - PubMed
-
- Kitchens RL, Thompson PA. Impact of sepsis-induced changes in plasma on LPS interactions with monocytes and plasma lipoproteins: roles of soluble CD14, LBP, and acute phase lipoproteins. J Endotoxin Res. 2003;9:113–118. - PubMed
LinkOut - more resources
Full Text Sources
Research Materials
Miscellaneous
