. 2007 Nov;15(11):1442-51.
doi: 10.1016/j.str.2007.09.010.

Structural mapping of protein interactions reveals differences in evolutionary pressures correlated to mRNA level and protein abundance

Affiliations

Structural mapping of protein interactions reveals differences in evolutionary pressures correlated to mRNA level and protein abundance

Matt Eames et al. Structure. 2007 Nov.

Abstract

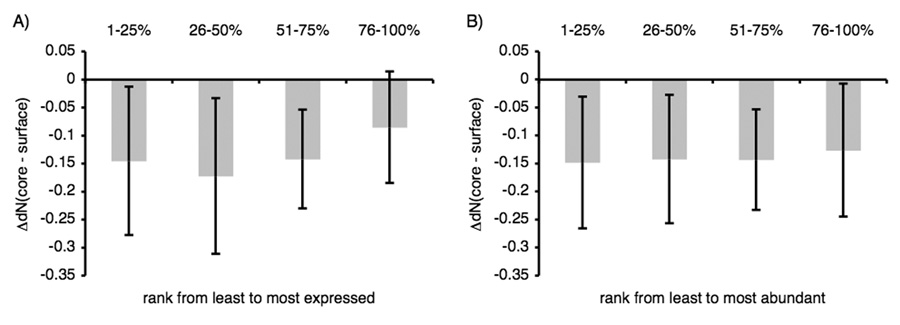
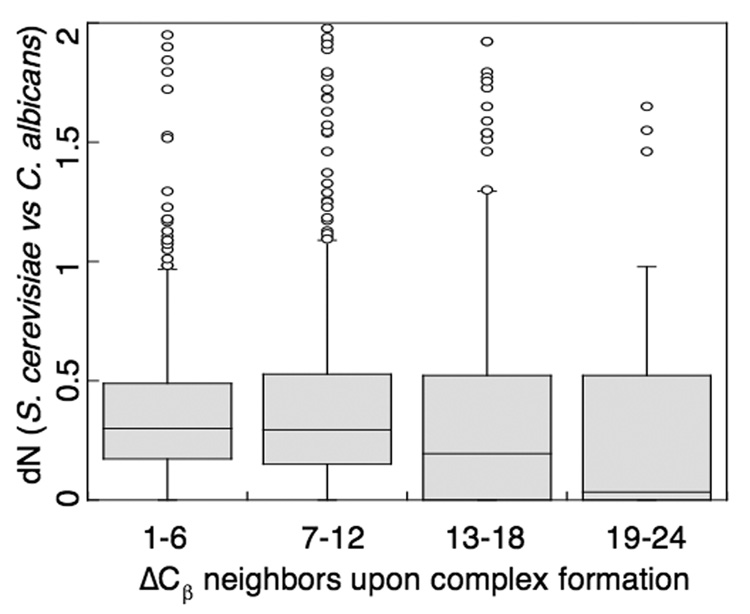
Genome-wide studies in Saccharomyces cerevisiae concluded that the dominant determinant of protein evolutionary rates is expression level: highly expressed proteins generally evolve most slowly. To determine how this constraint affects the evolution of protein interactions, we directly measure evolutionary rates of protein interface, surface, and core residues by structurally mapping domain interactions to yeast genomes. We find that mRNA level and protein abundance, though correlated, report on pressures affecting regions of proteins differently. Pressures proportional to mRNA level slow evolutionary rates of all structural regions and reduce the variability in rate differences between interfaces and other surfaces. In contrast, the evolutionary rate variation within a domain is much less correlated to protein abundance. Distinct pressures may be associated primarily with the cost (mRNA level) and functional (protein abundance) benefit of protein production. Interfaces of proteins with low mRNA levels may have higher evolutionary flexibility and could constitute the raw material for new functions.


Figures

Figure 1
Figure 1
Illustration of the computational strategy. (A) Flow cart outlining the steps for genome-wide structural mapping of S. cerevisiae domains and determination of evolutionary rates for structural subsets. (B) Cartoon depicting the 4 structural subsets used in this analysis.
Figure 2
Figure 2
Distributions of non-synonymous substitution rates, dN, for residue subsets with different structural characteristics. Boxes enclose the first and third quartile of the distribution and display a notch at the median; whiskers extend outward to the most extreme data point no more than three times the interquartile range from the box. Data points outside this range are drawn individually. As defined by a Wilcoxon-signed rank test, the dN distributions for all structural characteristics are significantly different from each other (P < 0.005) with exception of “buried residues” and “buried interface residues” (P = 0.18, not significant). 4 outliers fall outside the upper boundary.
Figure 3
Figure 3
The evolutionary rate differences between structural regions within the same domain is reduced at high mRNA expression levels. Shown (A) is the difference in dN between the core residues and surface residues subsets for each domain as a function of mRNA expression level or (B) the difference between the buried interface residues and surface residues sets. One outlier falls outside the limits in (B).
Figure 4
Figure 4
Pressures proportional to a protein’s mRNA expression level affect the degree of conservation in all structural subsets, whereas the effects of protein abundance are substantially weaker. Shown are the median dN values for protein sets binned by increasing mRNA expression level (A) or protein abundance (B). As defined by a Wilcoxon-signed rank test, the dN distributions for all expression bins are significantly different from each other within each structural subset class (P ≤ 0.004, with the exception of 26–50% vs 51–75% for all four subsets). The dN distributions for all abundance bins are not significantly different within each structural subset class (P > 0.01, with the exception of 1–25% vs 76–100% for all four subsets. For a list of P values, see Table S3.
Figure 5
Figure 5
mRNA expression level reduces the evolutionary rate differences between buried interface and surface residues of the same domain, while protein abundance does not. The distribution of differences in dN between the buried interface residues and surface residues sets as grouped by expression extremes (A) or abundance extremes (B). The extremes reflect the 17.5% highest and lowest expressed genes (A) or abundant proteins (B). Using the Kolmogorov-Smirnov test, we found a significant difference between the two expression distributions, but not between the two abundance distributions (P = 0.0004 for (A), P = 0.835 for (B)). One outlier falls outside the limits in (B).
Figure 6
Figure 6
The mean difference in evolutionary rates of core and surface residues within the same domain decreases with mRNA level, but not with protein abundance. The mean ΔdN(core-surface) for proteins is binned by increasing mRNA expression level (A) or protein abundance (B). The whiskers represent standard deviations within each bin.
Figure 7
Figure 7
The evolutionary rates of interface residues depend on the degree of burial upon complex formation. As defined by a Wilcoxon-signed rank test, the dN distributions for all degree of burial bins are significantly different from each other (P < 3e-7) with the exception of the first two bins 1–6, 7–12 (P = 0.58) and the last two 13–18, 19–24 (P = 0.06). Bin 1–6 represents 22,210 residues; bin 7–12, 14,479 residues; bin 13–18, 3,229 residues; bin 19–24, 418 residues. 9 outliers fall outside the upper boundary.

Similar articles

Cited by

References

    1. Aloy P, Ceulemans H, Stark A, Russell RB. The relationship between sequence and interaction divergence in proteins. Journal of molecular biology. 2003;332:989–998. - PubMed
    1. Altschul SF, Gish W, Miller W, Myers EW, Lipman DJ. Basic local alignment search tool. Journal of molecular biology. 1990;215:403–410. - PubMed
    1. Berman HM, Westbrook J, Feng Z, Gilliland G, Bhat TN, Weissig H, Shindyalov IN, Bourne PE. The Protein Data Bank. Nucleic Acids Res. 2000;28:235–242. - PMC - PubMed
    1. Bloom JD, Adami C. Apparent dependence of protein evolutionary rate on number of interactions is linked to biases in protein-protein interactions data sets. BMC Evol Biol. 2003;3:21. - PMC - PubMed
    1. Bloom JD, Adami C. Evolutionary rate depends on number of protein-protein interactions independently of gene expression level: response. BMC Evol Biol. 2004;4:14. - PMC - PubMed

Publication types

MeSH terms

Substances

LinkOut - more resources