

Nanoparticles as smart treatment-delivery systems in plants: assessment of different techniques of microscopy for their visualization in plant tissues
- PMID: 17998213
- PMCID: PMC2701844
- DOI: 10.1093/aob/mcm283
Nanoparticles as smart treatment-delivery systems in plants: assessment of different techniques of microscopy for their visualization in plant tissues
Abstract
Background and aims: The great potential of using nanodevices as delivery systems to specific targets in living organisms was first explored for medical uses. In plants, the same principles can be applied for a broad range of uses, in particular to tackle infections. Nanoparticles tagged to agrochemicals or other substances could reduce the damage to other plant tissues and the amount of chemicals released into the environment. To explore the benefits of applying nanotechnology to agriculture, the first stage is to work out the correct penetration and transport of the nanoparticles into plants. This research is aimed (a) to put forward a number of tools for the detection and analysis of core-shell magnetic nanoparticles introduced into plants and (b) to assess the use of such magnetic nanoparticles for their concentration in selected plant tissues by magnetic field gradients.
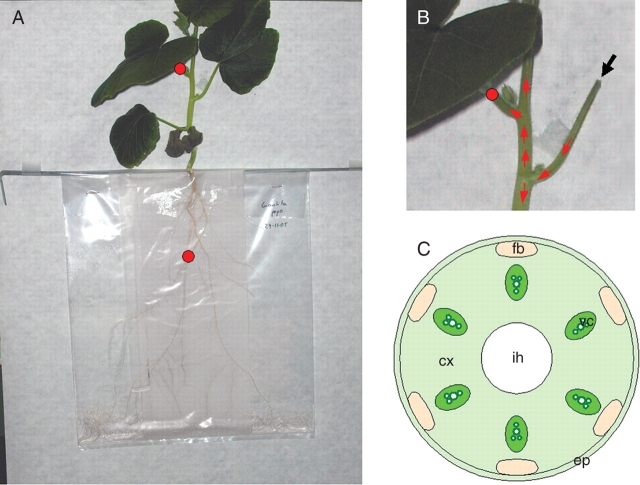
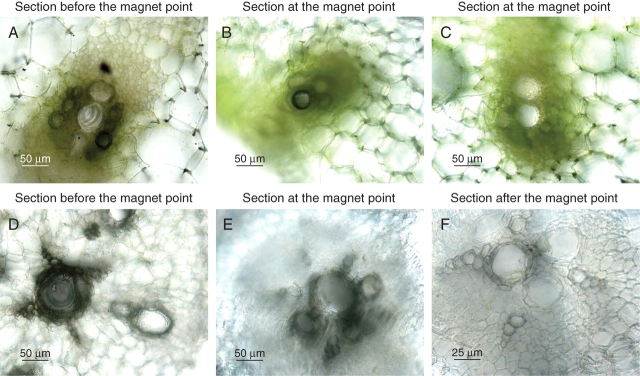
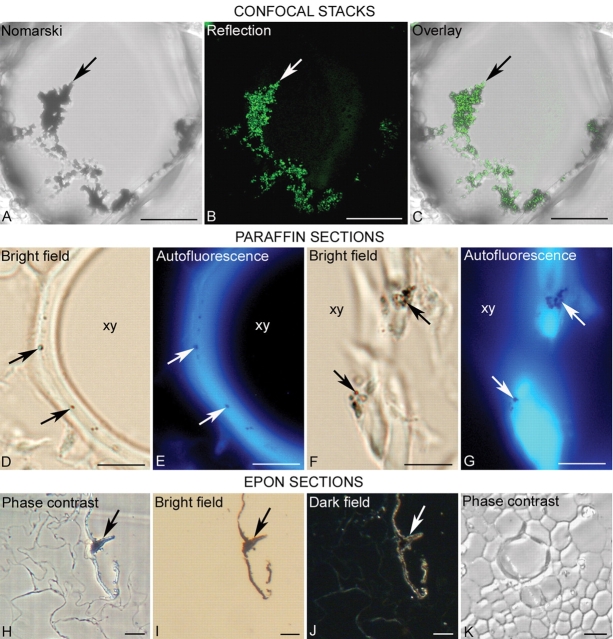
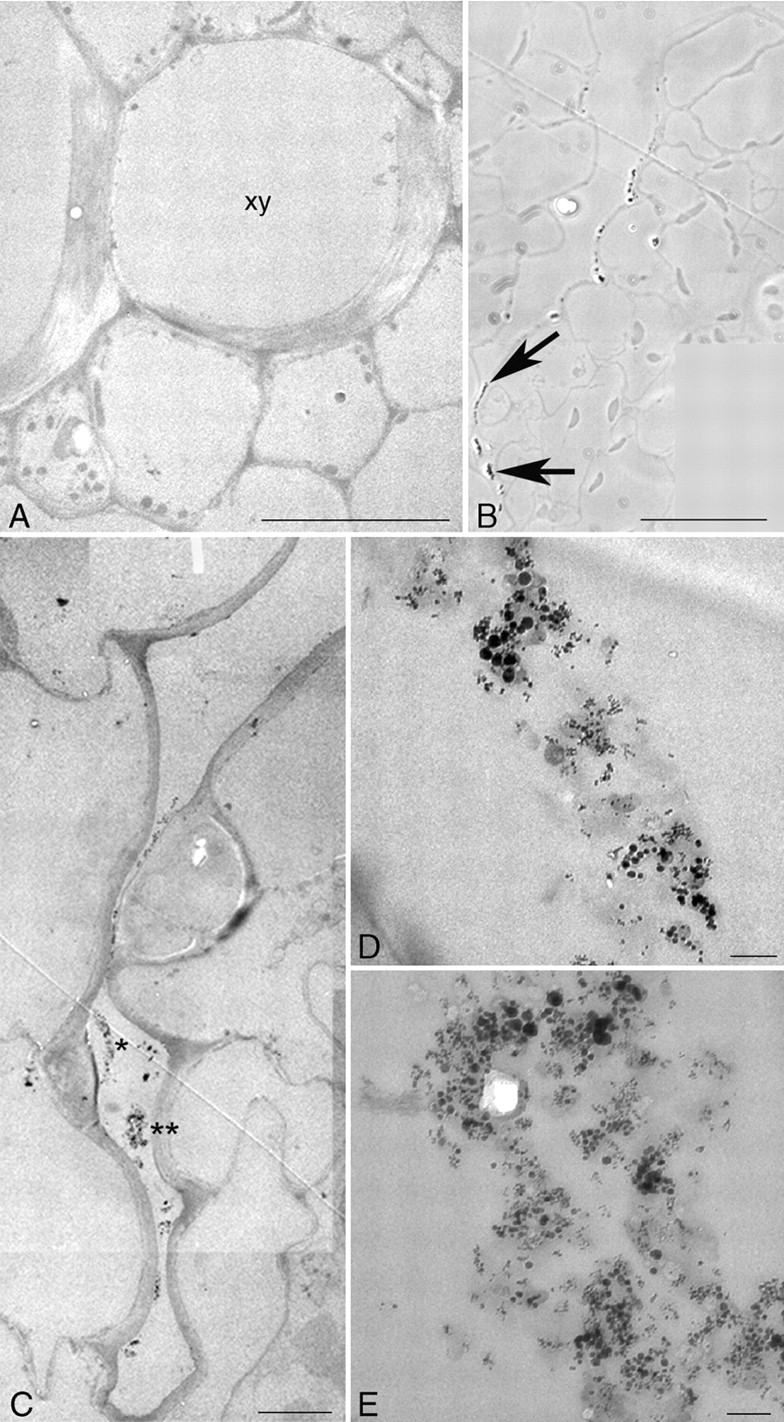
Methods: Cucurbita pepo plants were cultivated in vitro and treated with carbon-coated Fe nanoparticles. Different microscopy techniques were used for the detection and analysis of these magnetic nanoparticles, ranging from conventional light microscopy to confocal and electron microscopy.
Key results: Penetration and translocation of magnetic nanoparticles in whole living plants and into plant cells were determined. The magnetic character allowed nanoparticles to be positioned in the desired plant tissue by applying a magnetic field gradient there; also the graphitic shell made good visualization possible using different microscopy techniques.
Conclusions: The results open a wide range of possibilities for using magnetic nanoparticles in general plant research and agronomy. The nanoparticles can be charged with different substances, introduced within the plants and, if necessary, concentrated into localized areas by using magnets. Also simple or more complex microscopical techniques can be used in localization studies.
Figures
Similar articles
-
Nanoparticle penetration and transport in living pumpkin plants: in situ subcellular identification.BMC Plant Biol. 2009 Apr 23;9:45. doi: 10.1186/1471-2229-9-45. BMC Plant Biol. 2009. PMID: 19389253 Free PMC article.
-
Anti-cancer drug loaded iron-gold core-shell nanoparticles (Fe@Au) for magnetic drug targeting.J Nanosci Nanotechnol. 2010 Sep;10(9):5527-39. doi: 10.1166/jnn.2010.2461. J Nanosci Nanotechnol. 2010. PMID: 21133071
-
Carbon-iron magnetic nanoparticles for agronomic use in plants: promising but still a long way to go.Plant Signal Behav. 2010 Oct;5(10):1295-7. doi: 10.4161/psb.5.10.13080. Epub 2010 Oct 1. Plant Signal Behav. 2010. PMID: 20930509 Free PMC article.
-
Quantification of nanoparticles at the single-cell level: an overview about state-of-the-art techniques and their limitations.Nanomedicine (Lond). 2014;9(12):1885-900. doi: 10.2217/nnm.14.108. Nanomedicine (Lond). 2014. PMID: 25325243 Review.
-
Safety and nutritional assessment of GM plants and derived food and feed: the role of animal feeding trials.Food Chem Toxicol. 2008 Mar;46 Suppl 1:S2-70. doi: 10.1016/j.fct.2008.02.008. Epub 2008 Feb 13. Food Chem Toxicol. 2008. PMID: 18328408 Review.
Cited by
-
Engineered Nanoparticles, Natural Nanoclay and Biochar, as Carriers of Plant-Growth Promoting Bacteria.Nanomaterials (Basel). 2022 Dec 17;12(24):4474. doi: 10.3390/nano12244474. Nanomaterials (Basel). 2022. PMID: 36558327 Free PMC article.
-
Absorption and translocation to the aerial part of magnetic carbon-coated nanoparticles through the root of different crop plants.J Nanobiotechnology. 2010 Nov 8;8:26. doi: 10.1186/1477-3155-8-26. J Nanobiotechnology. 2010. PMID: 21059206 Free PMC article.
-
Myconanotechnology in agriculture: a perspective.World J Microbiol Biotechnol. 2013 Feb;29(2):191-207. doi: 10.1007/s11274-012-1171-6. Epub 2012 Sep 22. World J Microbiol Biotechnol. 2013. PMID: 23001741 Review.
-
Quantitative Understanding of Nanoparticle Uptake in Watermelon Plants.Front Plant Sci. 2016 Aug 26;7:1288. doi: 10.3389/fpls.2016.01288. eCollection 2016. Front Plant Sci. 2016. PMID: 27617020 Free PMC article.
-
Transport of Nanoparticles into Plants and Their Detection Methods.Nanomaterials (Basel). 2024 Jan 5;14(2):131. doi: 10.3390/nano14020131. Nanomaterials (Basel). 2024. PMID: 38251096 Free PMC article. Review.
References
-
- Alexiou C, Wolfgang A, Klein RJ, Parak FG, Hulin P, Bergemann C, et al. Locoregional cancer treatment with magnetic drug targeting. Cancer Research. 2000;60:6641–6648. - PubMed
-
- Alexiou C, Jurgons R, Schmid R, Hilpert A, Bergemann C, Parak F, et al. In vitro and in vivo investigation of targeted chemotherapy with magnetic nanoparticles. Journal of Magnetism and Magnetic Materials. 2005;293:389–393.
-
- Brunner TJ, Wick P, Manser P, Spohn P, Grass RN, Limbach LK, et al. In vitro cytotoxicity of oxide nanoparticles: comparison of asbestos, silica, and the effect of particle solubility. Environmental Science and Technology. 2006;40:4374–4381. - PubMed
-
- Cotae V, Creanga I. LHC II system sensitivity to magnetic fluids. Journal of Magnetism and Magnetic Materials. 2005;289:459–62.
Publication types
MeSH terms
Substances
LinkOut - more resources
Full Text Sources
Other Literature Sources
